Blank Fishbone Diagram

Login to download this file
Popular Search Terms
Timeline Infographic
Business Deck
Roadmap Template
Pitch Deck
Sales Deck
Pyramid
Essentials
Must-have decks for quick wins
By Industry
Professionally tailored slides for every sector
By Style
Minimal, modern and creative designs
By Topic
Explore slides curated by purpose and theme
Timeline
Roadmap
Strategy
Goals
Table
Comparison
SWOT
Agenda
Arrow
World Map
Maps
Process
Funnel
Team
Org Chart
Pyramid
Circular
Business Plan
Business Strategy
Business Proposal
Business Models
Digital Marketing
Marketing Funnel
Customer Experience
Project Status
Gantt Chart
Recruitment
Employee Performance
Leadership
AI
Machine Learning
AI Presentation Maker
Install the Windows plugin for quick access to templates and design tools.
AI Infographics Maker
Use our Office 365 add - in to access templates directly from the cloud.
Exe Version
Install the Windows plugin for quick access to templates and design tools.
Office 365
Use our Office 365 add - in to access templates directly from the cloud.
Mac Version
Get the Mac plugin to easily browse, insert, and customize templates and visuals within PowerPoint.
Home » Blank Fishbone Diagram Template for PowerPoint & Google Slides » Blank Fishbone Diagram

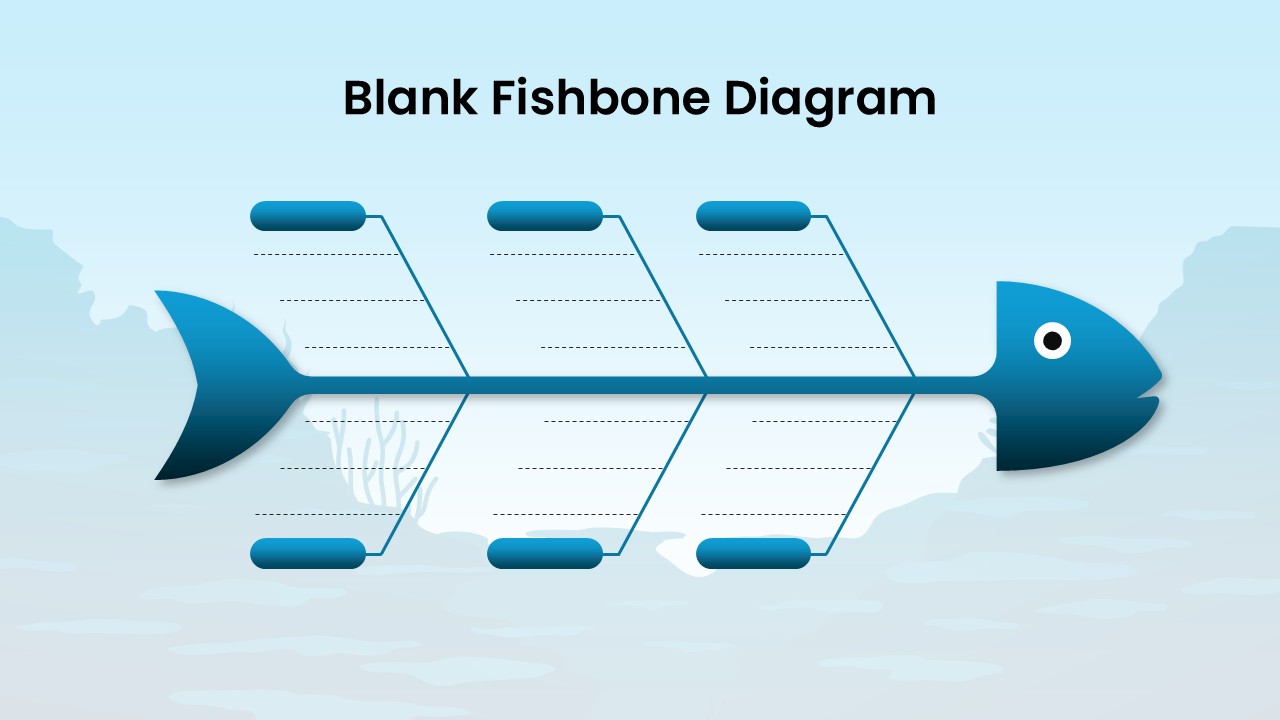
This Blank Fishbone Diagram presentation slide illustrates a clean, fish-shaped cause-and-effect layout used for root cause analysis. The slide features a central spine with multiple angled branches and labeled header nodes where different problem categories can be added. Each branch includes dotted lines for listing contributing factors, creating structured content areas for organized brainstorming. The design uses a modern blue color palette with a visual fish head and tail to guide the analysis flow. This slide is fully editable in both PowerPoint and Google Slides, making it ideal for business strategy, quality management, and problem-solving presentations.
Login to download this file
No. of Slides
2Item ID
SB05821Designed By
Naseeba SitharaRating
0.0
(0 reviews)