Mustard and Navy Balance Scale Metaphor Template for PowerPoint & Google Slides
Description
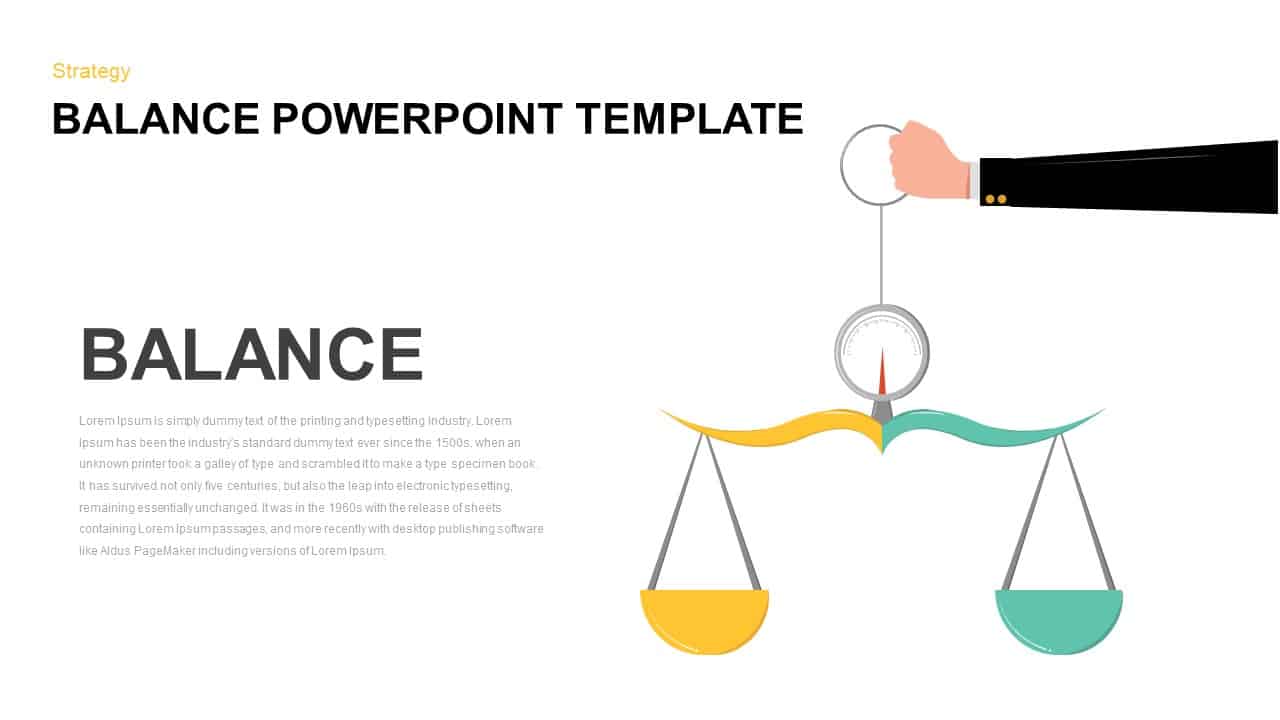
Leverage this minimalist balance scale metaphor slide to illustrate comparative analysis and strategic trade-offs with visual clarity. A mustard-yellow background sets a warm tone, while a navy-blue vector scale icon sits within a subtle circular backdrop on the right. On the left, a bold white “BALANCE” headline and customizable text block provide space for introductions, explanations, or key narratives. The flat icon features two hanging pans connected to a central beam, enabling metaphorical representation of pros and cons, strengths and weaknesses, or resource allocations. Semi-transparent navigation arrows along the slide edges suggest step-by-step progressions or carousel-style walkthroughs.
Built on fully editable master slides, this template empowers rapid customization. Replace the scale icon with a custom vector graphic, adjust hue values to match brand palettes, or modify the circular backdrop radius in seconds. Text placeholders support any font or style, while vector elements maintain pixel-perfect clarity across both PowerPoint and Google Slides. The slide’s simple layout and balanced white space ensure readability in boardrooms, virtual meetings, or printed handouts. The contrasting color pairing of mustard and navy draws attention to the core concept while reinforcing visual hierarchy.
Ideal for presenting SWOT trade-offs, cost-benefit analyses, or policy evaluations, this balance metaphor infographic enhances comprehension and retention. Use the title placeholder to frame your session theme, then adapt the body text for bullet points, metrics, or narrative storytelling. Duplicate the slide to compare multiple scenarios side by side, or combine with other infographics in your deck to reinforce strategic alignment. Its adaptable color scheme, scalable assets, and seamless cross-platform compatibility make this slide a versatile asset for consultants, executives, and educators seeking to drive impactful, data-driven discussions.
The slide’s flat-modern aesthetic and balanced composition make it adaptable for virtual and in-person settings. Use it to support keynote addresses, boardroom briefings, or online training modules. With built-in layout guides and cohesive styling, you’ll maintain brand cohesion across your entire deck. Compatible with both widescreen and standard formats, this template ensures your balance metaphor remains impactful whether projected in auditoriums or shared on virtual platforms.
Who is it for
Business strategists, consultants, project managers, and educators will leverage this balance scale slide to illustrate trade-offs, assess options, and present comparative data in boardroom presentations, stakeholder workshops, or academic lectures.
Other Uses
Repurpose this slide to visualize resource allocations, risk assessments, feature prioritizations, or performance benchmarks. Swap the scale icon for alternative metaphors like a seesaw or fulcrum to match diverse presentation themes.
Login to download this file


