austria-map-powerpoint-and-keynote1


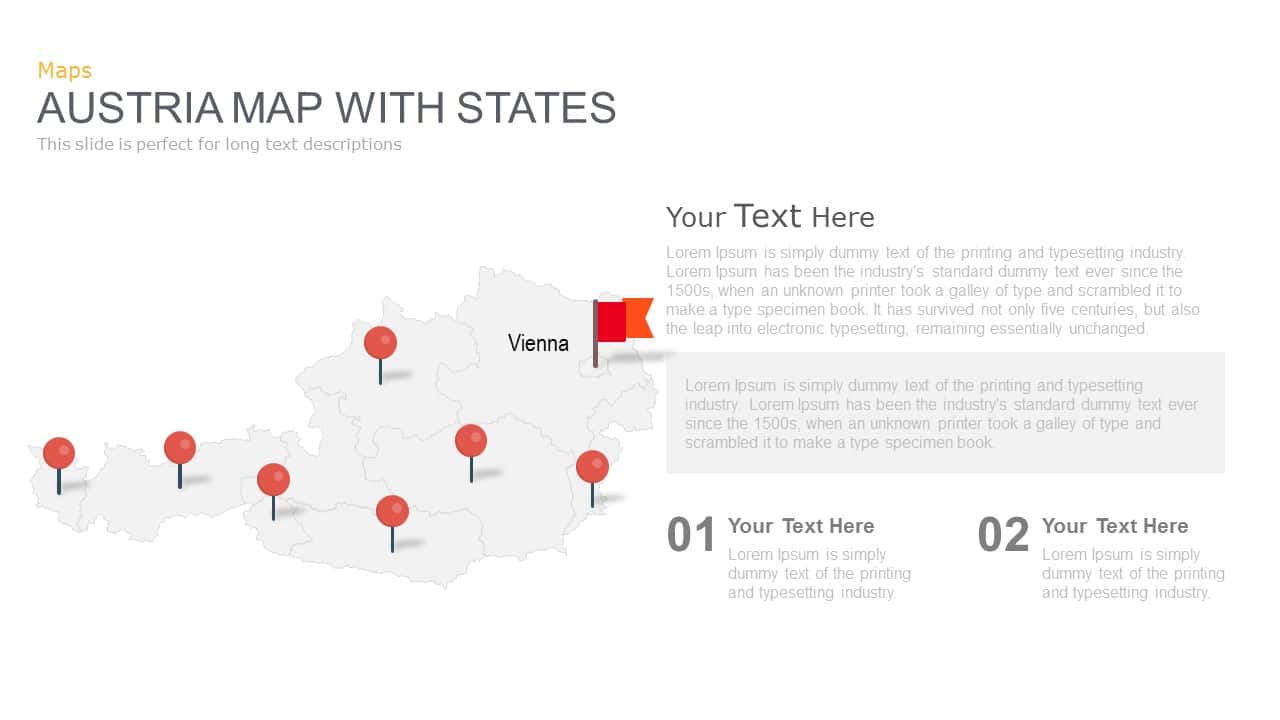
Leverage this versatile Austria map slide deck to visualize state-level data and regional insights with precision and professional polish. The fully editable template features a high-resolution vector map of Austria with defined state boundaries and multiple customizable marker styles. It offers five distinct slide layouts: a basic map with movable location pins; a zoom-in callout panel for detailed annotations; an integrated bar-chart layout for side-by-side analytics; dual hexagon percentage callouts for demographic highlights; and a titled text box layout tailored for long-form descriptions.
Each layout is built on PowerPoint and Google Slides masters, enabling rapid customization of marker positions, colors, icons, and text fields without disrupting the overall design. Vector objects maintain crisp clarity at any scale, while subtle drop shadows add depth without clutter. Theme-switching support lets you alternate between light and dark backgrounds to suit any branding or presentation environment. All elements are grouped and labeled for effortless edits by non-designers and seasoned professionals alike.
This slide deck also supports preset animations and motion paths to introduce markers, charts, or callouts sequentially, guiding audience attention through your narrative. Whether you’re delivering a boardroom presentation, webinar, or on-site briefing, these layouts adapt seamlessly across devices and screen sizes, ensuring consistent formatting and eliminating version control headaches.
Who is it for
Regional managers, marketing teams, and data analysts can leverage this map deck for state-by-state sales reports, performance reviews, and geographic trend studies. Consultants, educators, and policy advisors will find it ideal for presenting research findings, program updates, and strategic overviews.
Other Uses
Beyond regional reporting, repurpose this deck for supply chain mapping, tourism hotspot analyses, electoral visualization, or public health dashboards. Duplicate and compare slides to track temporal changes or overlay additional data widgets for enriched storytelling.
Login to download this file


