search

Essentials

Must-have decks for quick wins

By Industry

Professionally tailored slides for every sector

By Style

Minimal, modern and creative designs

By Topic

Explore slides curated by purpose and theme

TimelineTimelineRoadmapRoadmapStrategyStrategyGoalsGoalsTableTableComparisonComparisonSWOTSWOTAgendaAgendaArrowArrowWorld MapWorld MapMapsMapsProcessProcessFunnelFunnelTeamTeamOrg ChartOrg ChartPyramidPyramidCircularCircular

Business PlanBusiness PlanBusiness StrategyBusiness StrategyBusiness ProposalBusiness ProposalBusiness ModelsBusiness ModelsDigital MarketingDigital MarketingMarketing FunnelMarketing FunnelCustomer ExperienceCustomer ExperienceProject StatusProject StatusGantt ChartGantt ChartRecruitmentRecruitmentEmployee PerformanceEmployee PerformanceLeadershipLeadershipAIAIMachine LearningMachine Learning

AI Presentation Maker

Install the Windows plugin for quick access to templates and design tools.

AI Infographics Maker

Use our Office 365 add - in to access templates directly from the cloud.

Exe Version

Install the Windows plugin for quick access to templates and design tools.

Office 365

Use our Office 365 add - in to access templates directly from the cloud.

Mac Version

Get the Mac plugin to easily browse, insert, and customize templates and visuals within PowerPoint.

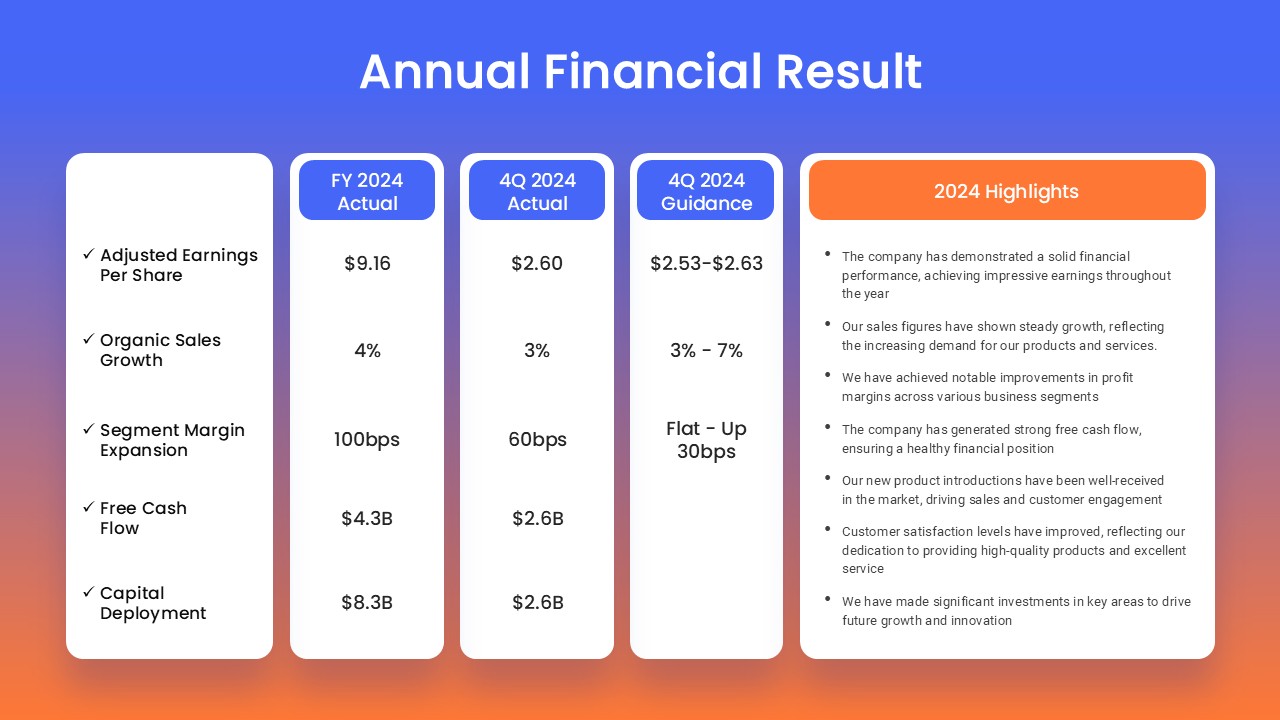
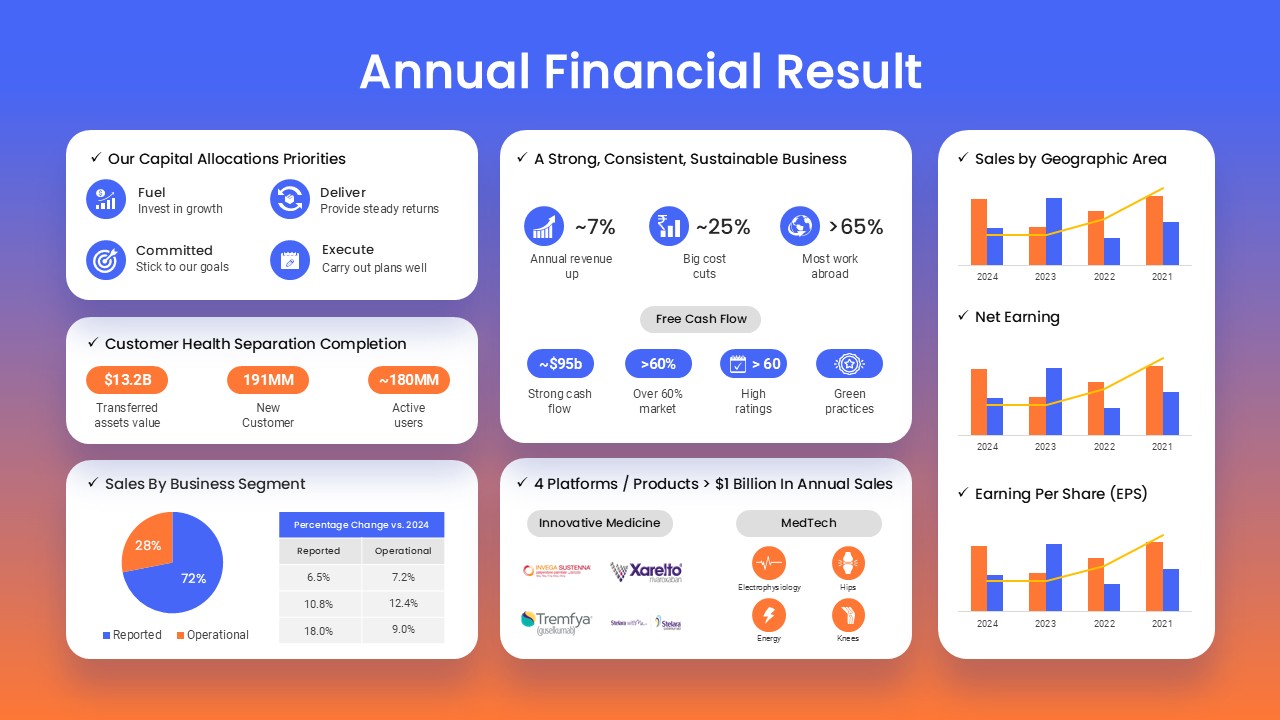
Year Annual Financial Results PowerPoint Presentation Templates

This template is part of a deck featuring multiple slides. To check out all slides, click on See All. See All round right arrow
Year Annual Financial Results PowerPoint Templates Featured image

Description

Leverage this comprehensive Annual Financial Results slide deck to present your company’s performance with precision and visual impact. The template includes versatile overview and detailed pages. The overview infographic slide features icon-accented panels that highlight capital allocation priorities, sustainability metrics, customer health indicators, and platform sales—alongside bar and line charts illustrating geographic revenue distribution, net earnings, and EPS trends over multiple years. The detailed financial summary slide organizes key metrics into labeled columns for fiscal year actuals, quarterly actuals, and guidance, paired with a highlights panel for bullet-point narratives on performance achievements and strategic initiatives.

Designed with clean white panels, crisp typography, and a modern gradient backdrop that transitions from bold blue to warm orange, this deck balances professionalism with a dynamic color scheme. Editable master slides empower you to update icons, adjust data callouts, and swap chart values in seconds, ensuring seamless integration with corporate branding. The high-resolution design guarantees consistent display quality across projectors, laptops, and mobile devices, eliminating formatting issues and keeping your data front and center.

Whether you’re delivering an investor earnings presentation, boardroom financial review, or stakeholder performance report, this slide deck drives clarity and alignment. Use the overview slide to quickly engage audiences with key infographics, then dive deeper using the detailed slide to discuss revenue growth, margin expansion, and cash flow guidance. Its reusable structure adapts to annual reports, quarterly reviews, product portfolio updates, and strategic planning sessions—empowering finance leaders, CFOs, and business analysts to showcase results, support decision-making, and build confidence through transparent, data-driven storytelling.

Who is it for

CFOs, finance managers, investor relations professionals, and business analysts will use this deck to communicate fiscal performance, trends, and forecasts to stakeholders. Corporate communications teams and board members can also leverage its clear structure for decision-making and reporting.

Other Uses

Adapt this slide deck for annual reports, quarterly earnings reviews, board meeting presentations, merger and acquisition evaluations, product portfolio summaries, and departmental KPI dashboards. Its modular design and editable charts make it ideal for any financial or strategic overview context.