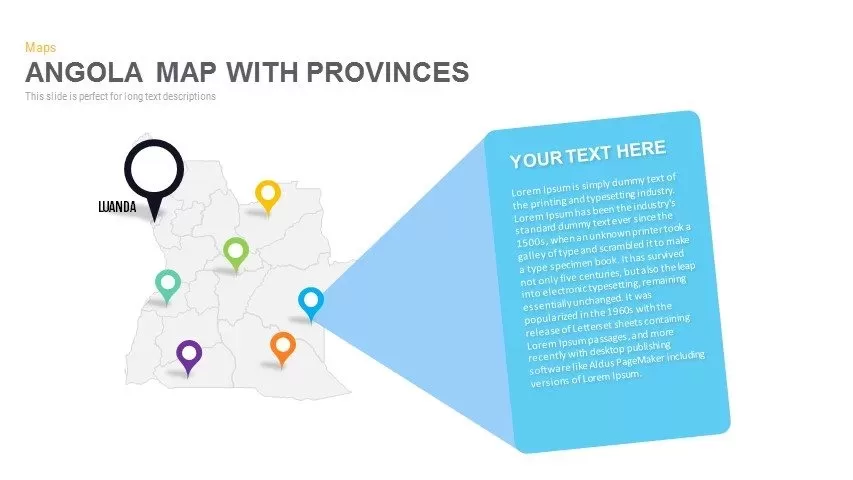
Angola Map With provinces Powerpoint and Keynote template


Description
This five-slide pack delivers versatile Angola map layouts complete with provincial boundaries and customizable markers for data-driven storytelling. The opening slide features a clean outline map accented with color-coded location pins and a large offset callout panel for highlighting a key province like Luanda. A secondary layout pairs the same map with a shaded text block and heading banner for in-depth regional analysis or narrative context. The third slide integrates multi-series bar charts alongside the map, enabling direct comparisons of provincial metrics such as population, sales volume, or resource distribution. The fourth variation displays uniformly styled push-pins marking all provinces, supported by dual numbered callouts for outlining two focal points or strategic priorities. Finally, the pack concludes with a demographic breakdown slide featuring hexagonal callouts—orange and red—illustrating percentage comparisons and icon-based user statistics. Across all slides, vibrant markers and callout shapes are vector-based for razor-sharp clarity at any resolution. Master slides ensure you can recolor regions, reposition pins, or swap icons in seconds without disturbing the overall layout. Text placeholders and chart data tables allow rapid content updates, while snap-to-guide alignment maintains professional spacing. The neutral white background and subtle drop shadows keep the focus on your data, making it suitable for boardroom presentations, webinars, and printed reports alike. Each map and chart is fully editable, letting you tailor color schemes and text to corporate branding guidelines. High-resolution vectors preserve crisp visuals on mobile devices, large screens, or printed collateral. Compatible with both PowerPoint and Google Slides, this template pack eliminates formatting headaches and streamlines collaborative editing—whether you’re presenting market share by province, planning infrastructure deployment, or visualizing survey results.
Who is it for
Sales managers, market analysts, and regional planners will find this template invaluable for displaying provincial metrics, highlighting strategic locations, and guiding data-driven discussions.
Other Uses
Beyond sales and planning, repurpose these slides for academic research, election results breakdowns, tourism development, resource allocation reports, or public policy presentations to illustrate geographic findings and regional comparisons.
Login to download this file


