AML Transaction Monitoring Template for PowerPoint & Google Slides
This is an architecture diagram, not a typical presentation slide. It maps out a complete anti-money laundering transaction monitoring system from data ingestion to regulatory reporting. Two versions, light and dark. 16:9. Editable in PowerPoint and Google Slides.
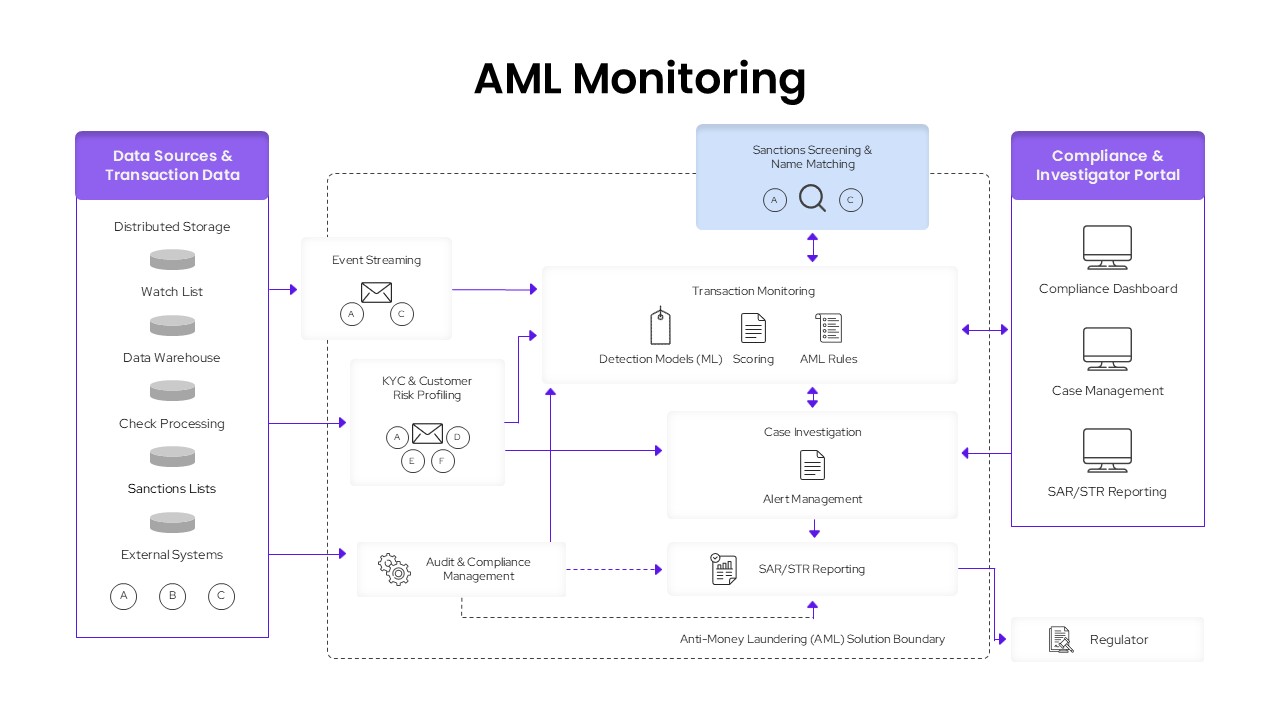
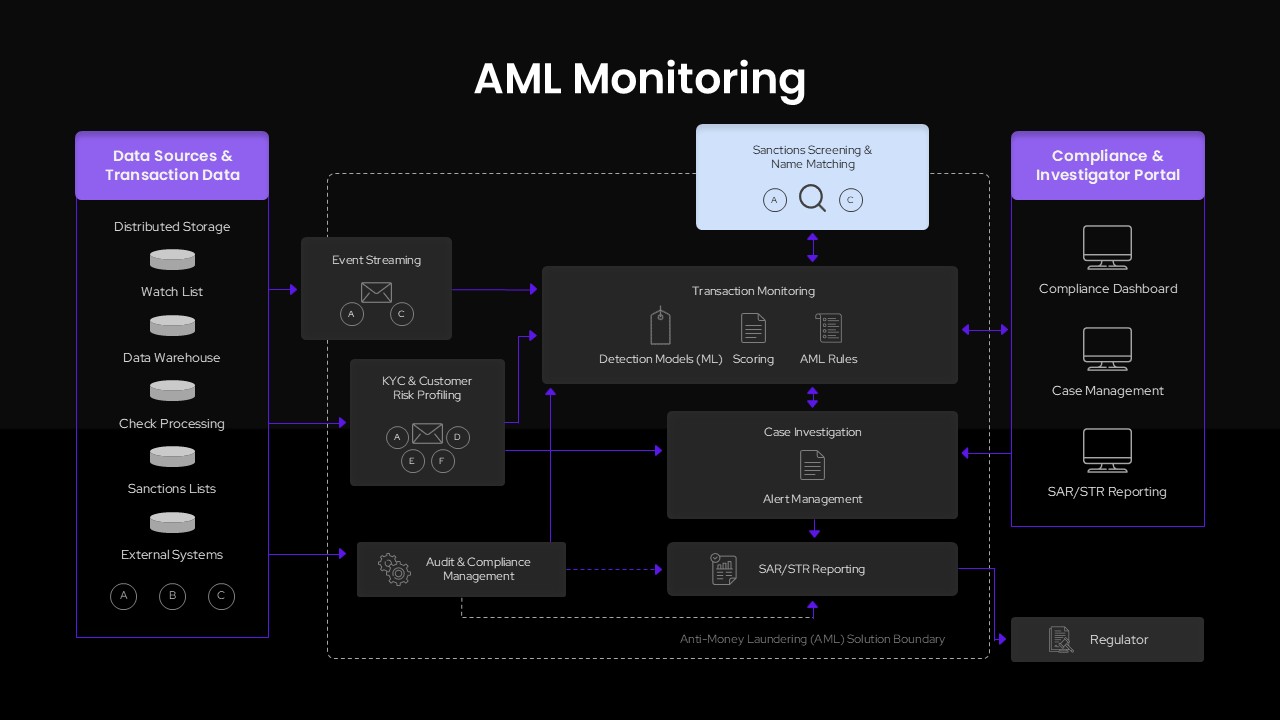
The diagram flows left to right across three zones:
Left side: Data Sources & Transaction Data. Six input sources stacked vertically: Distributed Storage, Watch List, Data Warehouse, Check Processing, Sanctions Lists, and External Systems. These feed into the central processing area through Event Streaming.
Center: The AML Solution Boundary. This is the core of the diagram. It includes Sanctions Screening & Name Matching at the top, KYC & Customer Risk Profiling below the event streaming layer, and Transaction Monitoring in the middle with three sub-components: Detection Models (ML), Scoring, and AML Rules. Below that sits Case Investigation and Alert Management. SAR/STR Reporting and Audit & Compliance Management sit at the bottom. Arrows show how data flows between these components.
Right side: Compliance & Investigator Portal. Three output systems: Compliance Dashboard, Case Management, and SAR/STR Reporting. Outside the solution boundary, a Regulator endpoint sits at the bottom right where suspicious activity reports get filed.
Where Compliance Teams Use This Diagram
Compliance officers present this during regulatory exams to show auditors how the bank’s AML system works end to end. It answers the question examiners always ask: “walk me through how a suspicious transaction gets from your core banking system to a SAR filing.” Having the full architecture on one slide means you’re not flipping through ten slides trying to explain data flow.
Banks and fintechs also use this internally when onboarding new compliance analysts. The diagram shows how the pieces connect: where transaction data comes from, how it gets screened, what triggers an alert, where cases get investigated, and how reports reach the regulator. That’s a lot of moving parts, and most new hires spend weeks figuring this out from documentation. One slide gives them the full picture on day one.
AML software vendors present this to prospects during sales demos. It maps directly to how RegTech platforms are structured, so vendors can overlay their product capabilities onto each component in the diagram: “our ML models sit here, our case management sits here, our SAR filing module connects here.”
The same diagram structure works for KYC process flows, fraud detection system architecture, sanctions compliance documentation, and any multi-stage monitoring system that feeds into regulatory reporting.
Get More Risk Management Templates here
Frequently Asked Questions
Can this template be customized for different financial institutions?
Does the template include both presentation themes?
Login to download this file

Item ID
SB05875Designed By
Naseeba Sithara
Related Templates

Website Performance Monitoring Dashboard Template for PowerPoint & Google Slides
Business Report
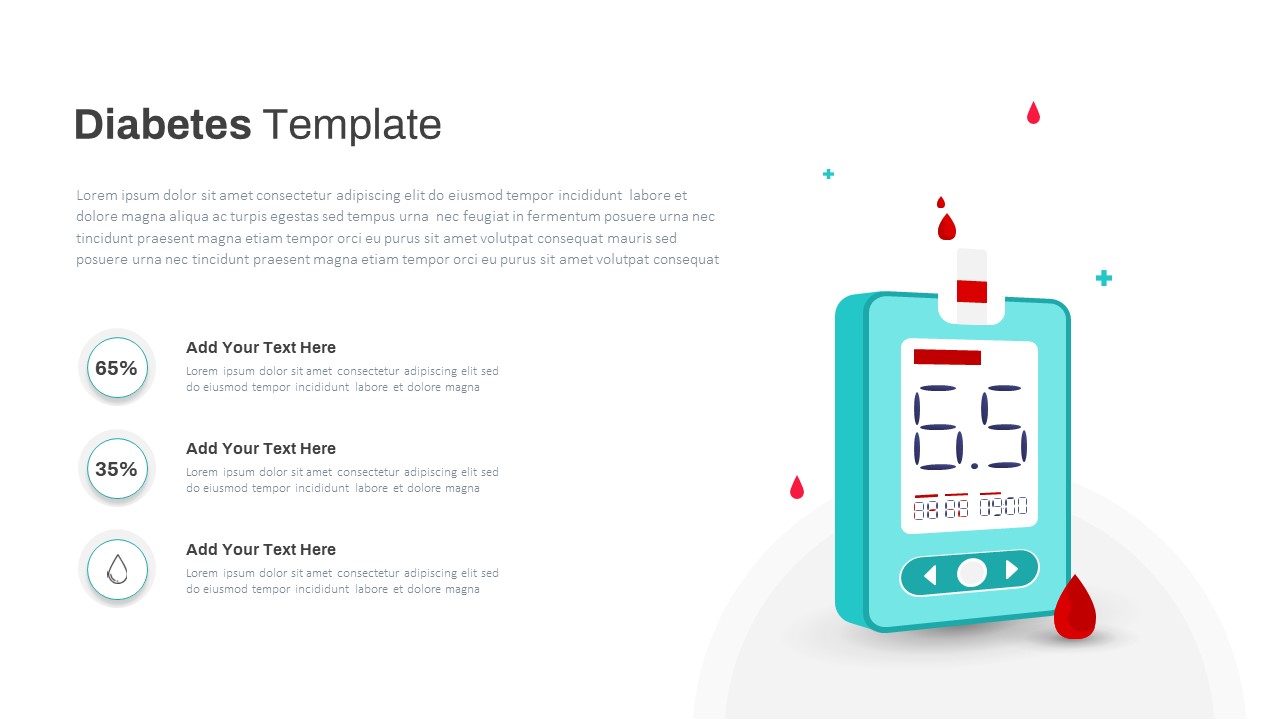
Diabetes Blood Glucose Monitoring Template for PowerPoint & Google Slides
Health
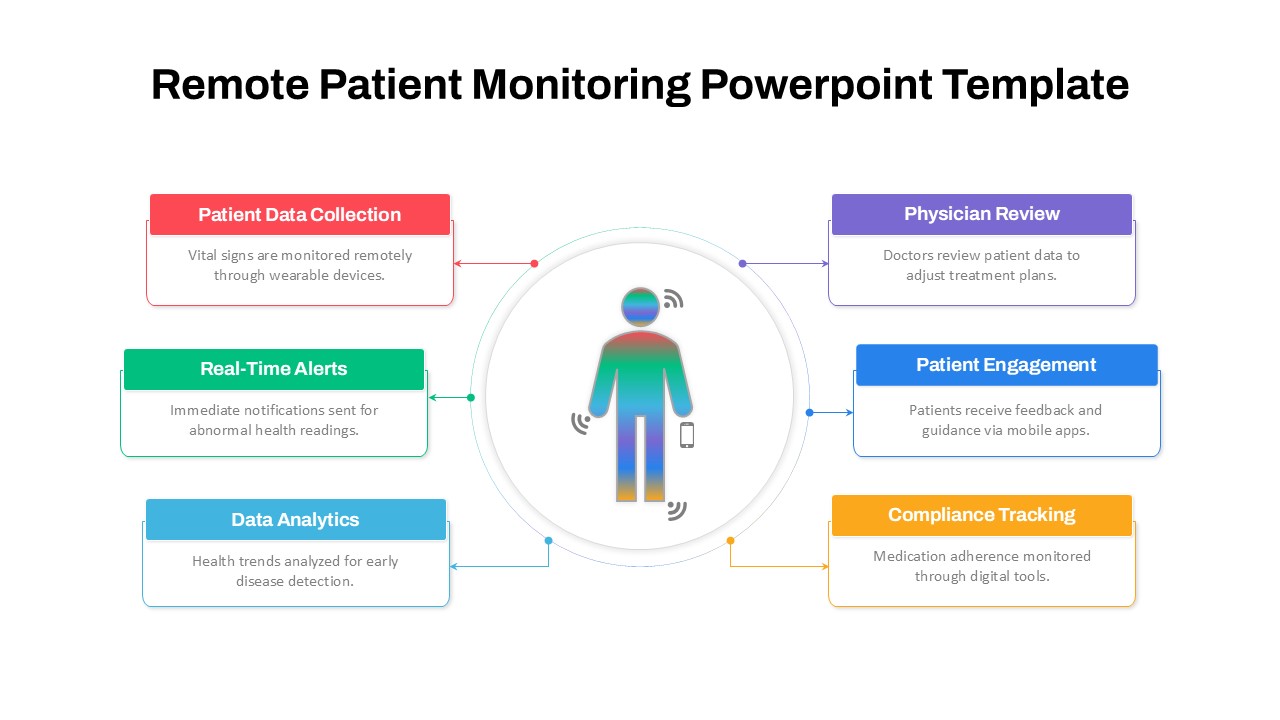
Remote Patient Monitoring Diagram Template for PowerPoint & Google Slides
Health
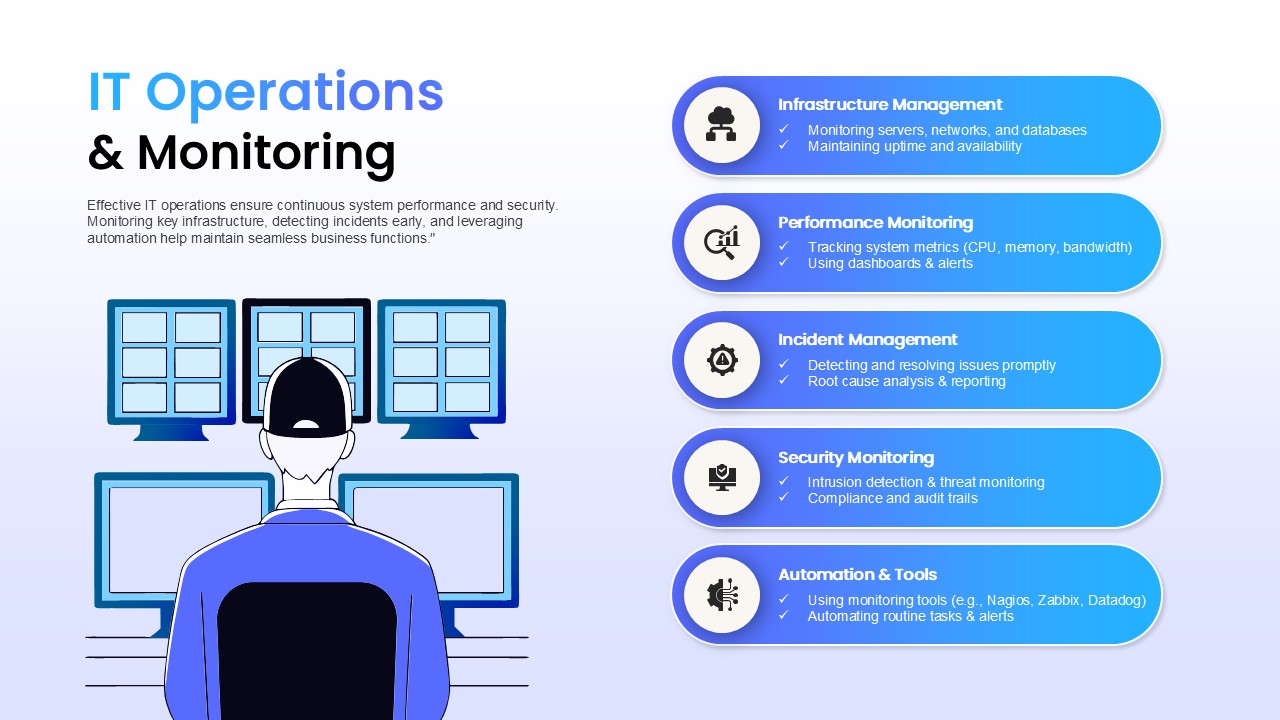
IT Operations & Monitoring Template for PowerPoint & Google Slides
Information Technology
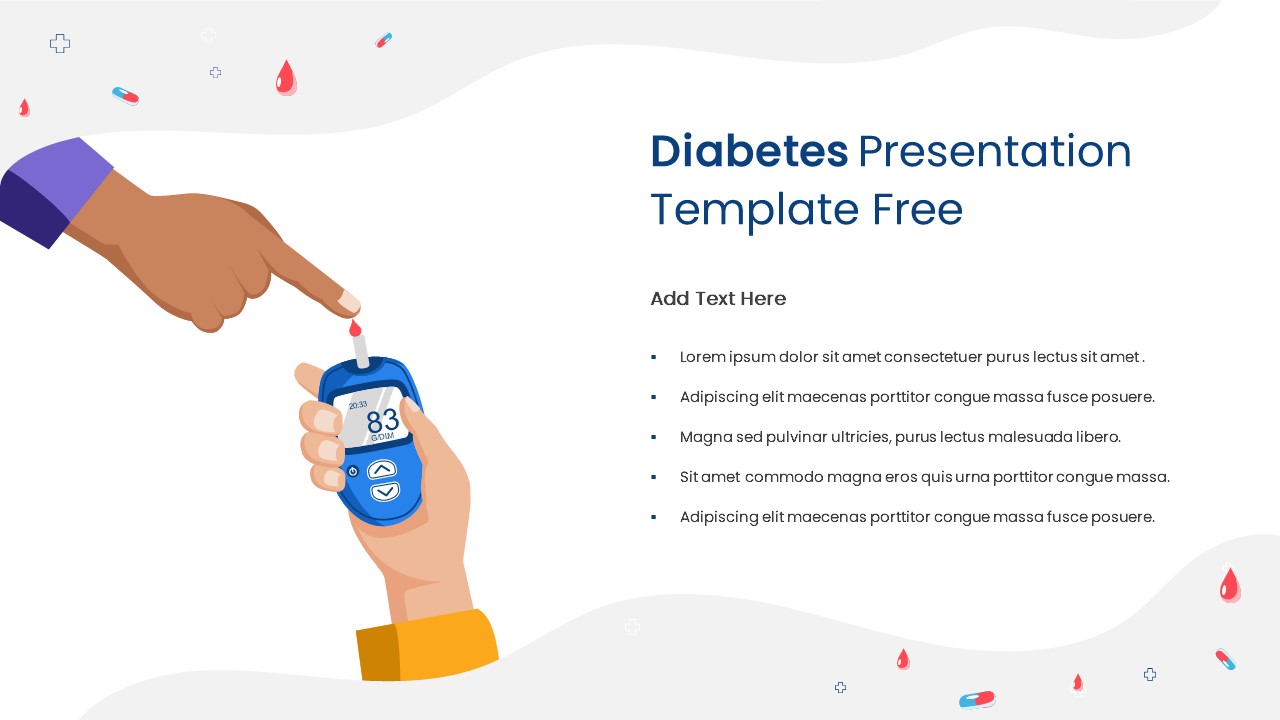
Free Diabetes Monitoring Awareness Slide for PowerPoint & Google Slides
Health
Free
4 Step Process PowerPoint & Google Slides Template for PowerPoint & Google Slides
Process