ai-data-ecosystem-map-template-powerpoint-google-slides

Description
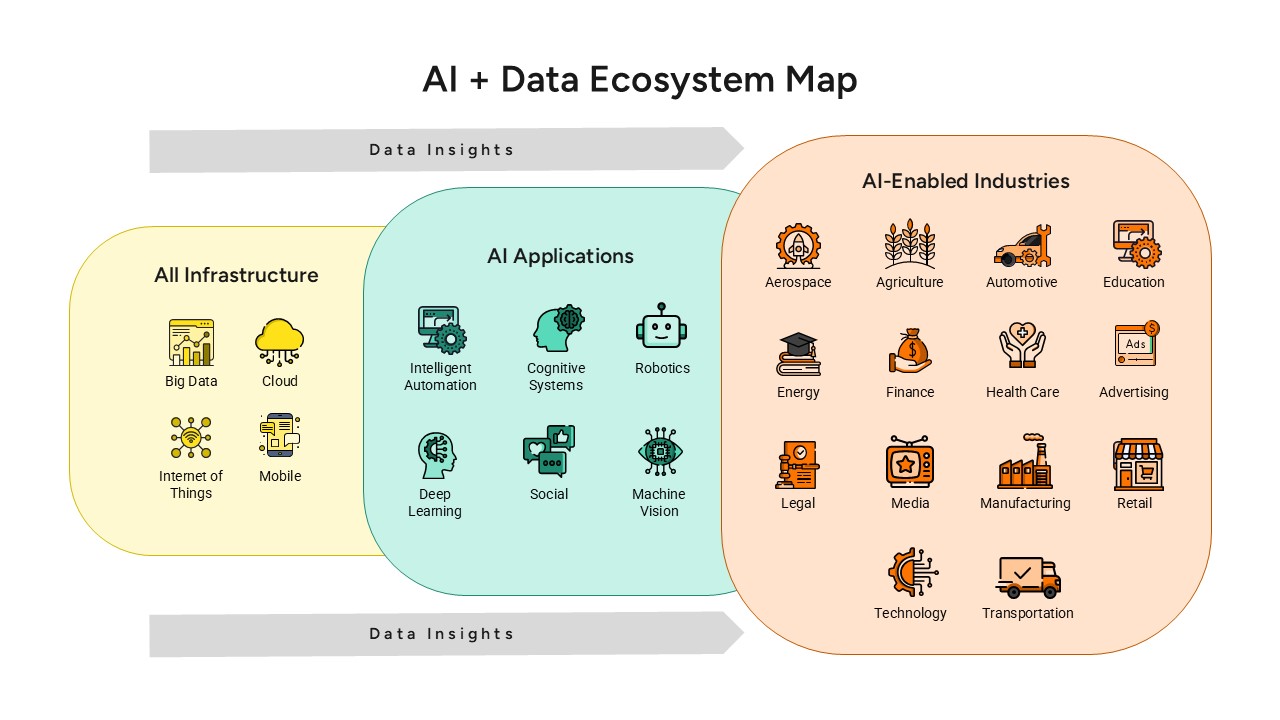
Visualize the flow from infrastructure to industry impact with this AI + Data ecosystem map. Three overlapping rounded panels represent your data foundation—Big Data, Cloud, Internet of Things, and Mobile—feeding into AI application layers—Intelligent Automation, Cognitive Systems, Robotics, Deep Learning, Social, and Machine Vision—and driving AI-enabled industries such as Aerospace, Agriculture, Automotive, Education, Energy, Finance, Health Care, and more. Clean iconography and distinct color zones guide viewers through how raw data transforms into actionable insights across sectors. A top and bottom ribbon labeled “Data Insights” bookends the diagram, reinforcing the end-to-end narrative.
Built in PowerPoint and Google Slides on master slides, this template supports instant theme color swaps and global font updates to align with your brand. All icons and shapes are vector-based for lossless scaling, and grouped elements auto-realign when you move panels or icons. Preconfigured animations let you reveal each layer sequentially—perfect for storytelling in workshops or executive briefings. Duplicate or hide panels to focus on specific infrastructure, application, or industry segments and use text placeholders to customize descriptions and data callouts.
Who is it for
Data strategists, AI leaders, and digital transformation specialists will leverage this map to illustrate platform roadmaps, solution portfolios, and industry use-cases during client pitches, solution-architecture reviews, and innovation workshops.
Other Uses
Repurpose this layout to map customer-journey stages, technology maturity models, or partner ecosystems by relabeling panel headings and swapping icons—turning the slide into a versatile tool for any layered framework.
Login to download this file


