Agriculture Infographic


Description
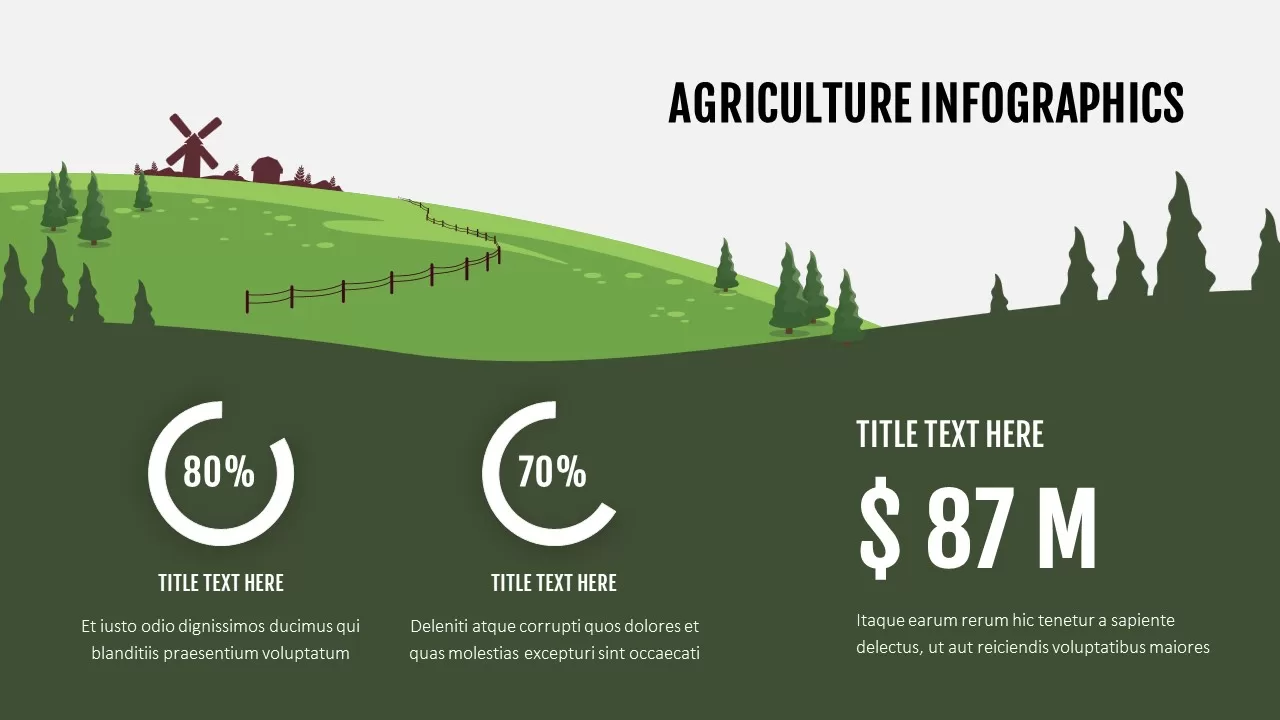
Visualize agricultural performance metrics and key financial figures with this Agriculture Infographics slide for PowerPoint & Google Slides. A stylized landscape backdrop featuring rolling green hills and a windmill sets the theme, while two clean, white circular progress rings display percentages—80% and 70%—against a contrasting dark-green footer. Beneath each ring, editable headings and descriptive text placeholders let you explain crop yields, sustainability targets, or resource utilization. To the right, a bold metric callout highlights your top-line figure (e.g., $87 M) with supporting text for revenue, investment, or harvest volume. All elements are built with vector shapes on master slides, so you can adjust percentages, swap out text, change colors, and scale the landscape graphic without disrupting alignment. Generous white space, minimalist sans-serif typography, and subtle drop shadows maintain a professional look that keeps your audience focused on the data.
Who is it for
Agribusiness managers, farm cooperative leaders, agronomists, and agricultural consultants who need a clear, visually engaging slide to report on crop performance, financial outcomes, or sustainability metrics.
Other Uses
Repurpose this slide to showcase environmental impact statistics, food production forecasts, operational KPIs, or any scenario where progress rings and a prominent financial figure communicate results at a glance.
Login to download this file


