Africa Map With Countries Powerpoint Keynote template

Description
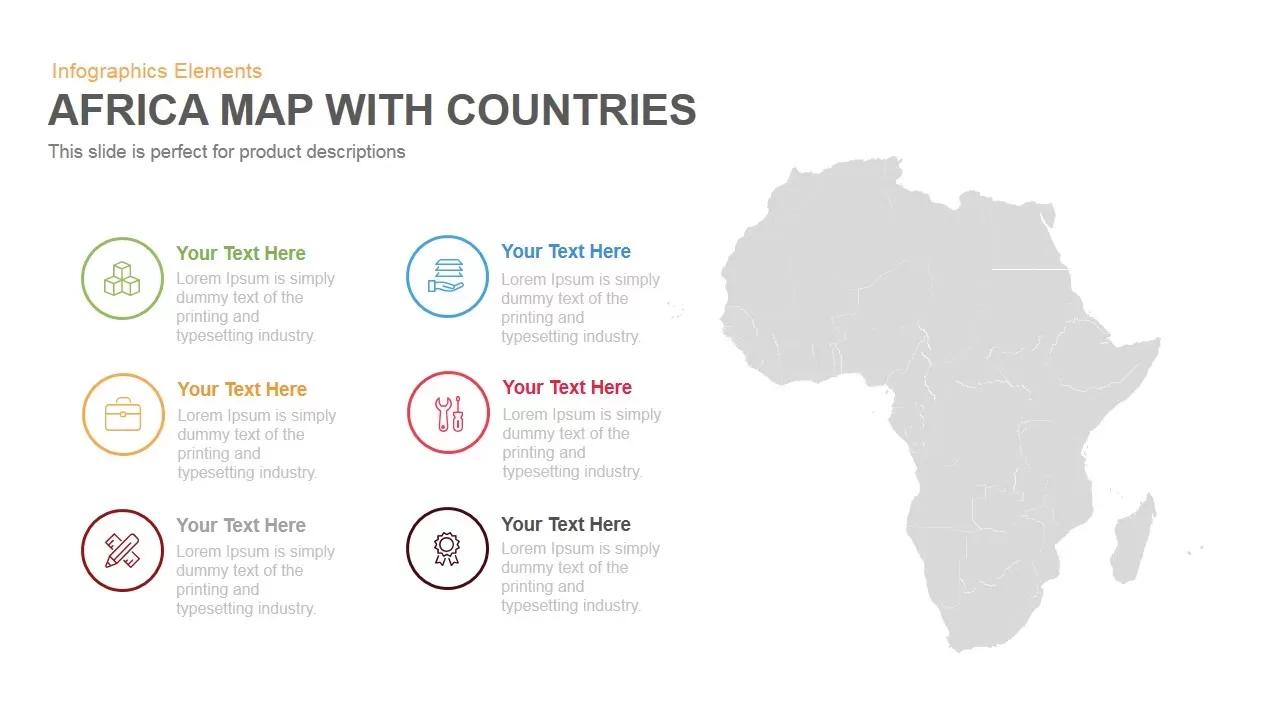
This slide features a detailed map of Africa positioned on the right side of the canvas, illustrating country boundaries in a clean grey silhouette. On the left, six icon-based callouts provide space for highlighting key regional insights or product descriptions. Each callout comprises a circular icon—such as stacked cubes, document exchange, briefcase, tools, pencil, and award ribbon—rendered in distinct accent colors (green, blue, yellow, red, maroon, and purple) with accompanying text placeholders. The top section supports a main title (“Africa Map with Countries”) and subtitle for framing the context. A spacious content area ensures that long-form narrative detailing market analysis, service offerings, or demographic data can be integrated seamlessly.
Built on flexible master slides, this template offers fully editable vector shapes, icons, and text placeholders for rapid customization. You can reposition callout icons, update color swatches, and modify text labels to align with branding guidelines. Alignment and distribution tools enable adding or removing callouts and scaling the map to focus on specific regions. The clean white background and modern sans-serif typography maintain professional aesthetics while ensuring data visuals stand out. This slide supports 16:9 and 4:3 aspect ratios, guaranteeing consistent display across screens, projectors, and printed materials. For dynamic storytelling, apply entrance animations to map callouts and text segments to guide audience attention through critical points sequentially. The intuitive layout also allows integration with dashboards, metrics slides, or narrative overviews in broader presentation decks. Whether you’re illustrating regional performance, product distribution, or strategic planning, this infographic slide combines clarity, versatility, and design impact to communicate complex information with ease.
Who is it for
Market researchers, demographic analysts, and business strategists can leverage this slide to present population distributions, market penetration, or service coverage across African countries. Educators, NGOs, and government agencies will find the icon callouts ideal for highlighting development indicators and program results.
Other Uses
Beyond regional analysis, repurpose this layout for sales territory maps, resource allocation plans, or geographic performance dashboards. Replace icons with metrics or project milestones to adapt the design for supply chain visualizations and infrastructure planning.
Login to download this file


