



















































6 Well Plate Template for PPT & Google Slides
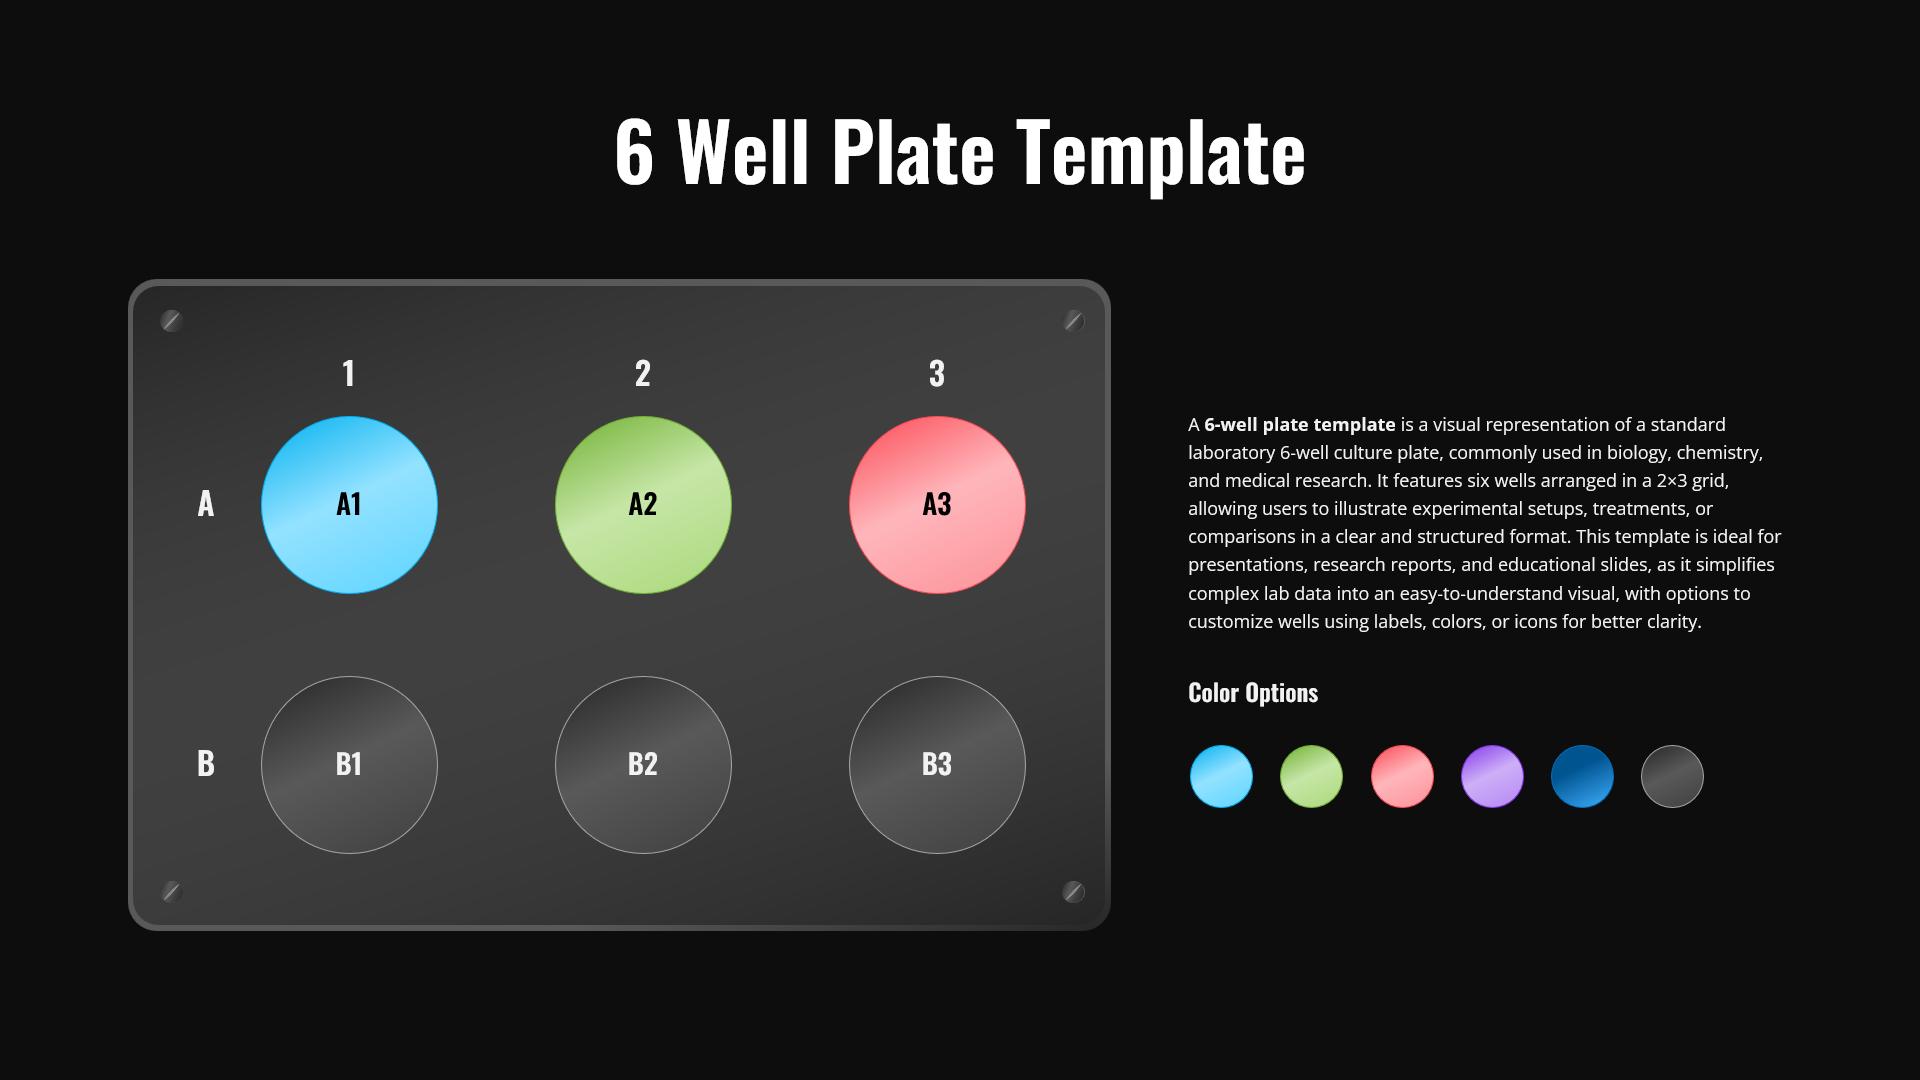
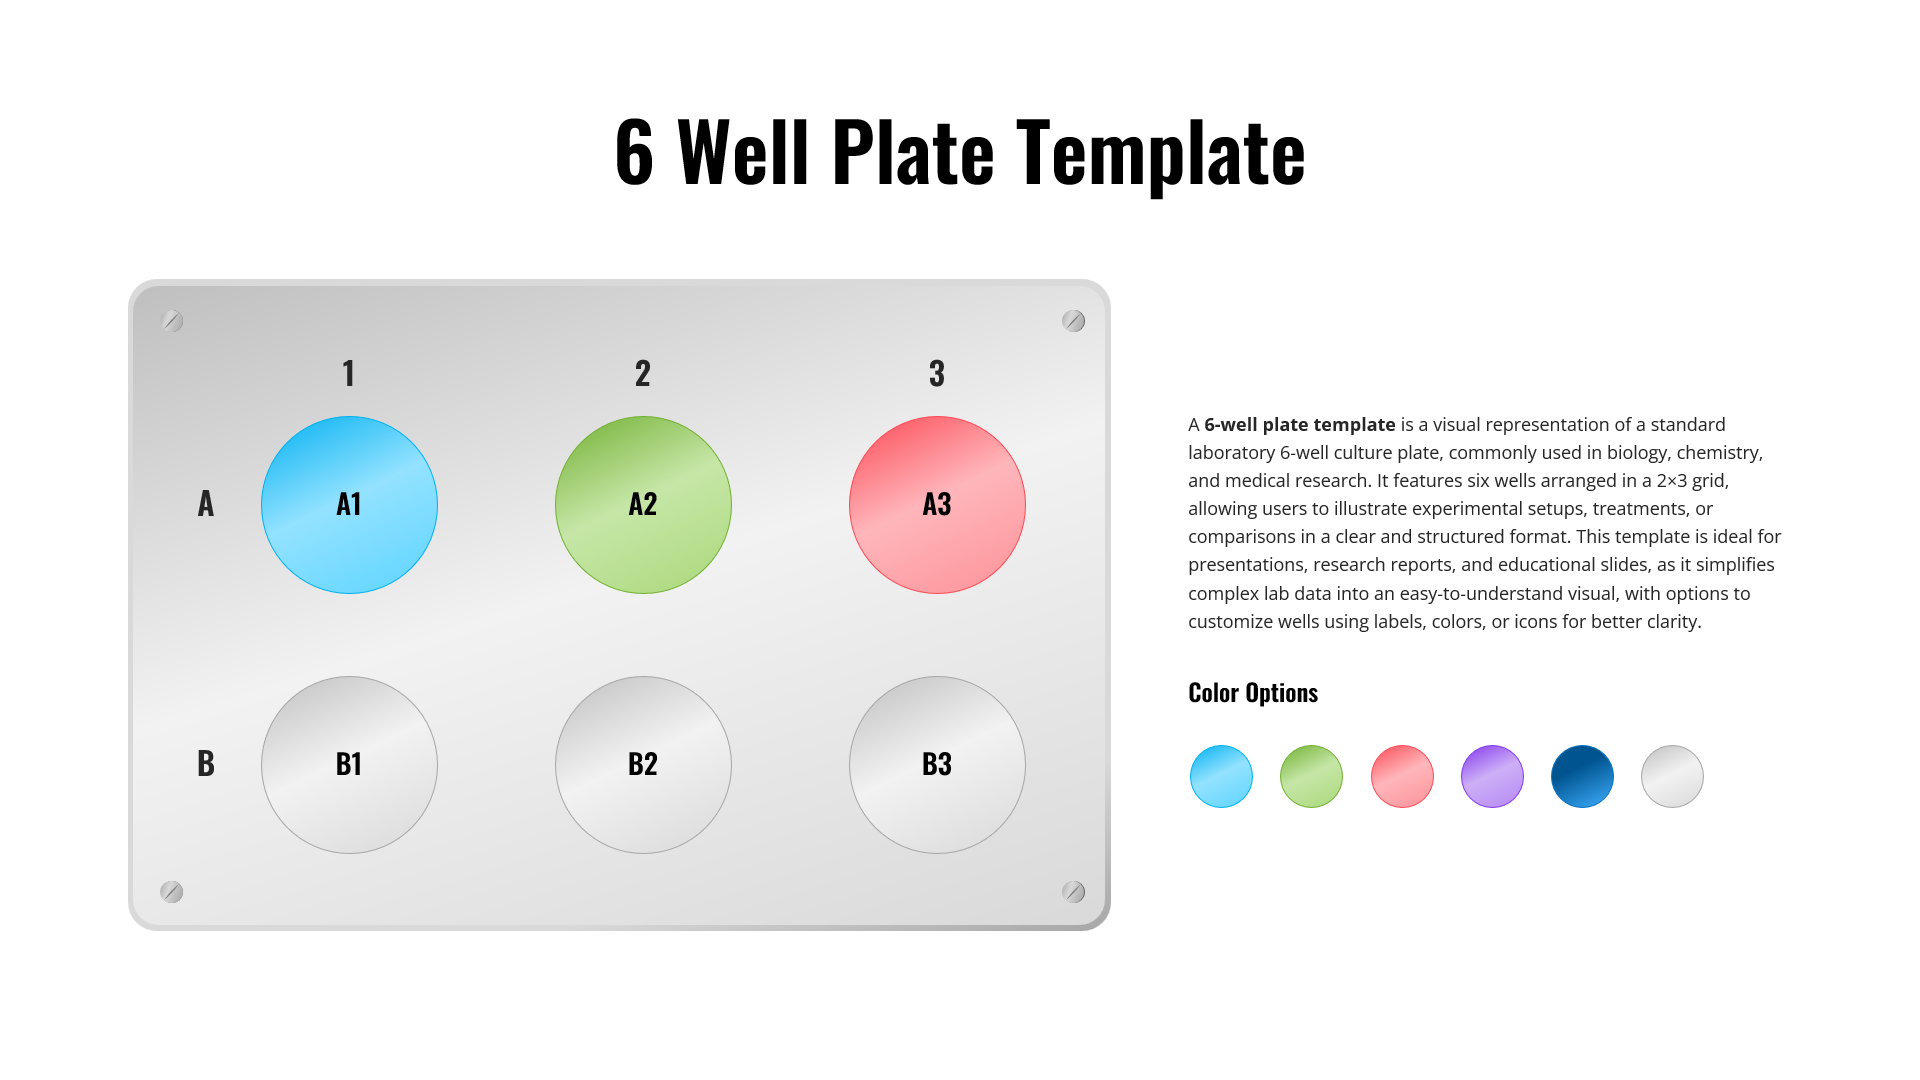
Lab data gets easier to follow once it has a shape to sit in, and this 6 Well Plate Template gives it exactly that. The layout mirrors a standard 6-well culture plate, six circular wells set in a 2×3 grid against a dark background, with each well labeled A1 through B3 and ready to be recolored to mark different treatments, sample groups, or experimental conditions. The dark backdrop does a lot of the work here, keeping color-coded results sharp and readable even when a slide is being viewed from across a room.
Biologists, medical researchers, and lab professionals use this kind of layout to walk through cell culture setups, assay results, or drug testing comparisons without burying the audience in raw data. Educators and students find it just as useful for turning an experimental design into something a class can actually follow. Every well’s label, color, and icon can be swapped out, so the same six-well grid adapts to a new study, a new set of variables, or an entirely different assay without needing to rebuild the slide from scratch, and it holds its resolution cleanly across both PowerPoint and Google Slides.
Outside the lab, the same 2×3 structure works for testing matrices, quality control comparisons, or general process mapping in pharmaceutical and academic presentations, anywhere six items need to sit side by side for direct comparison.
Login to download this file

Item ID
SB05614Designed By
Niranjana


