5 step 3d circular process diagram


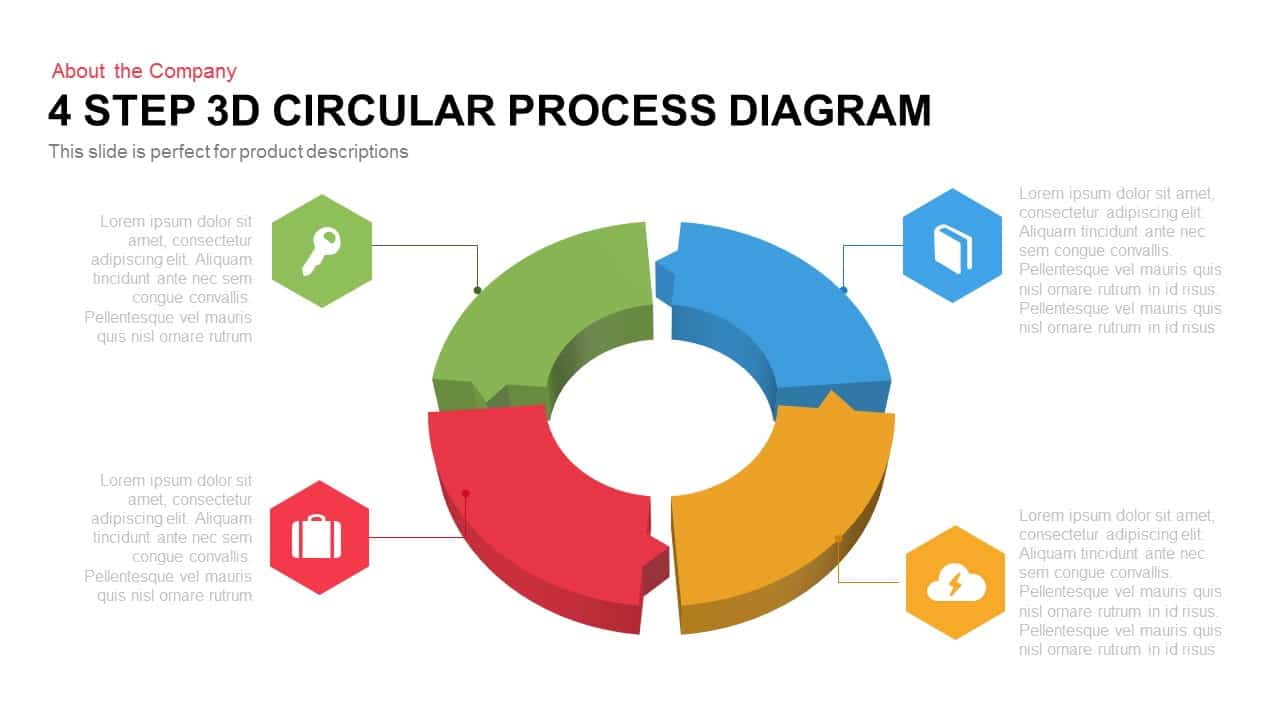
Use this vibrant 4-step 3D circular process diagram to illustrate sequential workflows, project phases, or product cycles with depth and clarity. The central donut chart features four extruded segments in bold green, blue, yellow, and red, each paired with a hexagonal icon placeholder connected by sleek callout lines. Adjacent text blocks on both sides allow space for detailed descriptions, specifications, or statistics. Fully editable vector shapes and master slide layouts let you customize segment order, swap icons, recolor layers, and adjust text in seconds, maintaining pixel-perfect alignment through built-in guides. The three-dimensional shading and consistent shadow effects create a dynamic visual hierarchy, guiding viewers through each stage in a clear, intuitive progression.
Designed for both PowerPoint and Google Slides, this template ensures consistent formatting, aspect ratios, and high-resolution clarity across devices, eliminating compatibility headaches. A clean white background enhances legibility, while support for dark background versions provides flexibility for varied branding themes. Modify connector line thickness, reposition callouts, or expand text placeholders to suit diverse content needs without manual formatting. The slide’s modern flat style, combined with subtle 3D depth, suits executive presentations, stakeholder briefings, and client workshops alike.
Built with simplicity and efficiency in mind, this asset leverages editable fonts, vector icons, and color themes that integrate seamlessly with corporate brand guidelines. Its structured layout streamlines the creation of animated slide sequences, allowing you to highlight steps one by one and maintain audience focus. Whether used to map marketing funnels, technology roadmaps, or service delivery cycles, this diagram brings professionalism and polish to every slide deck.
Who is it for
Project managers, product teams, consultants, and business analysts will benefit from this slide when mapping multi-stage processes—such as product development lifecycles, marketing campaigns, or technology rollouts. Marketing strategists can illustrate customer journeys, while educators and trainers may structure lecture modules or workshop agendas with clear visual cues. Stakeholders across finance, operations, and IT departments can adapt the diagram for roadmap presentations, performance reviews, and compliance checklists.
Other Uses
Repurpose the circular design to compare quarterly results, depict cyclical workflows, or break down resource allocation tiers. Transform each segment into departmental overviews, risk assessment categories, or customer segment profiles. Duplicate and recolor the diagram to create alternative viewpoints—such as SWOT analyses, process audits, and phased deployment plans. The editable vector elements also support data-driven dashboards, timeline summaries, and layered infographics, making this flexible asset indispensable for diverse presentation needs.
Login to download this file


