4-pieces-3d-pyramid-powerpoint-and-keynote-template1


Description
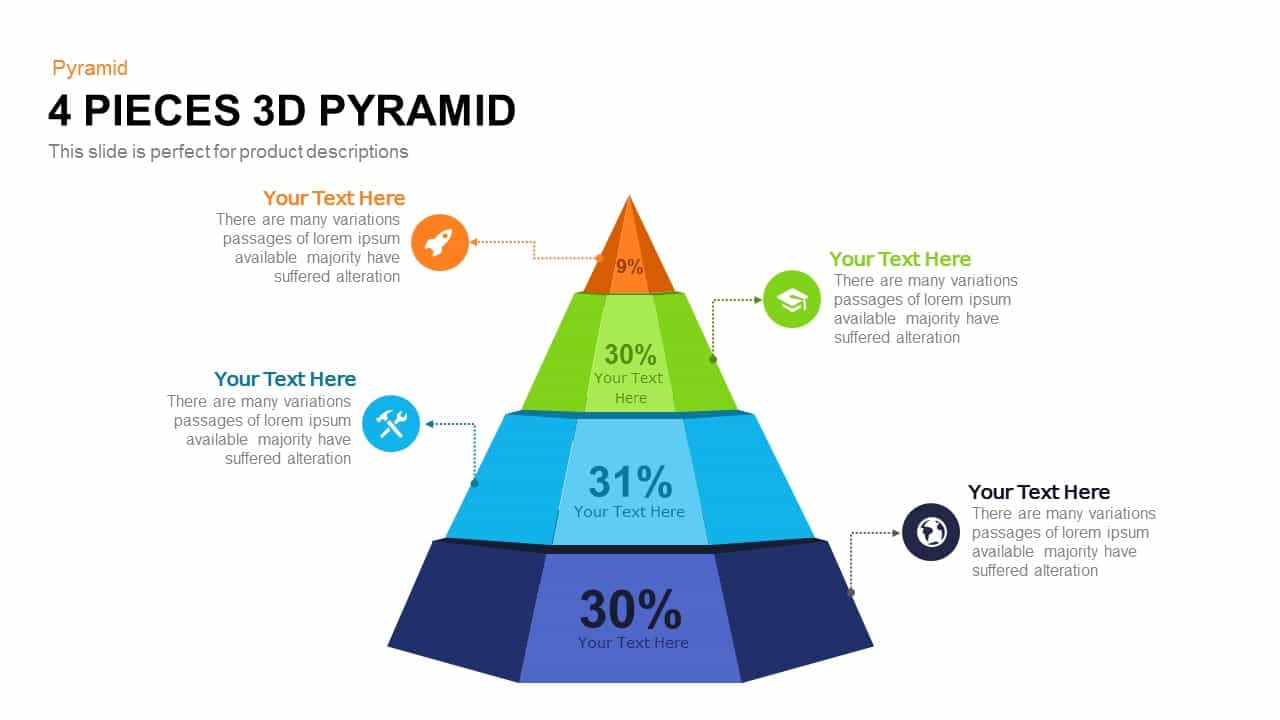
Leverage this four-piece 3D pyramid diagram slide to showcase hierarchical data and stage-specific metrics with depth and dimension. The centerpiece is a three-dimensional pyramid composed of four stacked layers rendered in crisp flat vector style on a clean white background. Each segment features a bold percentage marker at its core and is accented with gradient shading for added visual depth—dark blue at the base, medium blue, light blue, and green at the apex. Thin connector lines extend from each layer to circular icon placeholders, providing space for concise labels, illustrative icons, or key insights. This versatile design merges conceptual imagery with data-driven storytelling, ensuring your audience easily grasps complex structures.
Built on master slides, this asset leverages editable shape objects, vector graphics, and preformatted text styles to streamline customization. Swap icons, adjust colors, resize layers, and update percentage values or textual descriptions in seconds. Prelinked theme colors and slide background variants maintain consistency across your deck, while full-resolution fidelity across PowerPoint and Google Slides preserves crisp visuals on any display. Optional entrance animations enhance engagement during live presentations, and built-in safe-zone guides simplify final edits.
Ideal for visualizing organizational hierarchies, phased project roadmaps, layered resource allocations, or market-segmentation funnels, this pyramid diagram adapts effortlessly to multiple contexts. Use it to illustrate strategic objectives, performance benchmarks, risk-assessment tiers, or Maslow-inspired frameworks. Duplicate or reorder layers to fit three- or five-stage models, or integrate with other infographic slides to build comprehensive decks. With intuitive placeholders and robust formatting controls, this 3D pyramid slide empowers you to communicate multi-level information with clarity and impact.
Who is it for
Business strategists, project managers, marketing teams, and consultants will benefit from this slide when breaking down complex hierarchies, illustrating phased processes, or presenting layered metrics. Educators, trainers, and startup founders can also leverage its structured design to align stakeholders and facilitate data-driven discussions.
Other Uses
Beyond standard hierarchies, repurpose this slide for risk-assessment models, budget allocation breakdowns, product-tier comparisons, or talent-development frameworks. Adapt segment labels and colors to craft layered roadmaps, KPI dashboards, or segmented customer-journey maps with equal ease.
Login to download this file


