4 step business data


Description
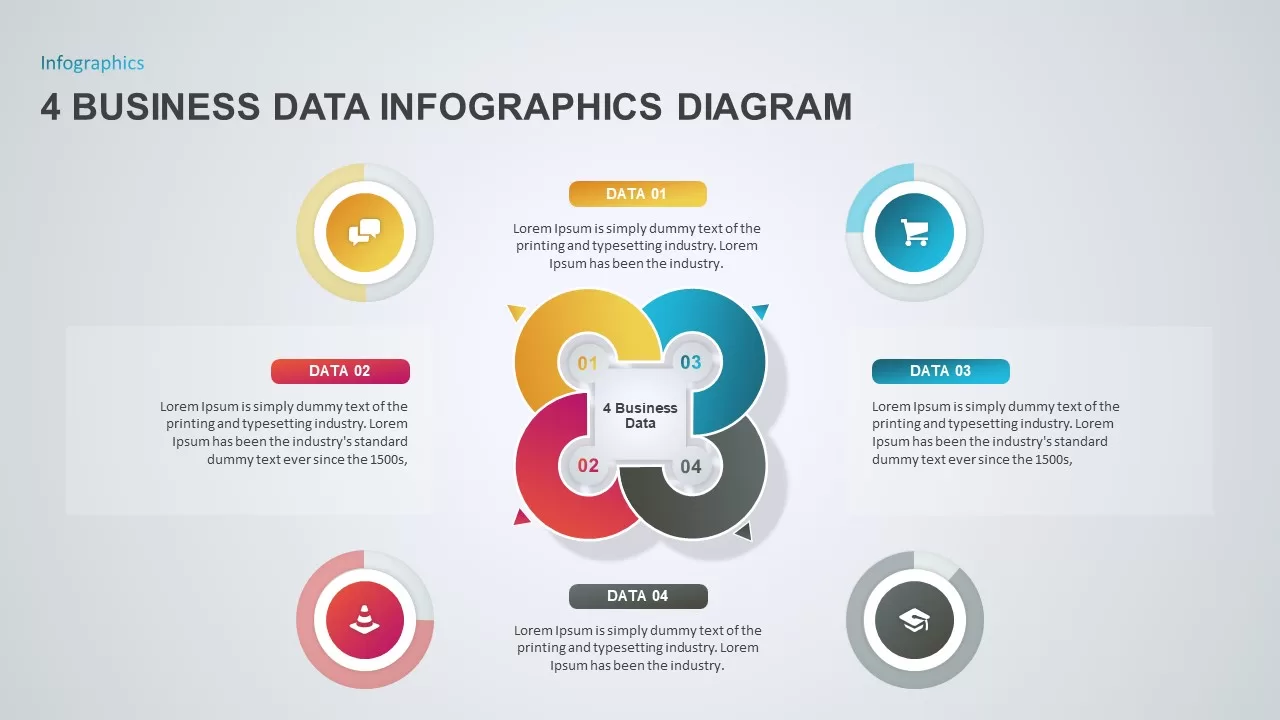
This 4 Business Data Infographics Diagram template is designed to help you present key business data in a clear, visually engaging way. Featuring four interconnected segments, each representing a different category of business data (labeled Data 01, Data 02, Data 03, and Data 04), this diagram allows you to break down complex information into digestible parts. Each section includes space for text and a corresponding icon, making it easy to present qualitative or quantitative data across multiple dimensions.
The vibrant color scheme and modern design make it an effective tool for conveying business insights, market trends, or performance metrics. This template is ideal for presentations that require a structured approach to presenting data, such as business reports, project updates, or strategy sessions. Whether you are reporting on marketing performance, financial results, or operational data, this diagram helps to highlight each key area of focus.
Fully editable in both PowerPoint and Google Slides, you can easily customize the text, icons, and colors to suit your specific business needs and branding.
Who is it for
This template is perfect for business analysts, marketers, project managers, and consultants who need to present multiple categories of data in a clean, organized manner. It’s ideal for teams working on business performance reports, strategic analyses, or project evaluations.
Other Uses
Apart from business presentations, this diagram can be adapted for educational purposes, such as explaining key concepts in a course, showcasing research findings, or presenting case study results. It’s also suitable for use in performance reviews, competitor analysis, or market research presentations.
Login to download this file


