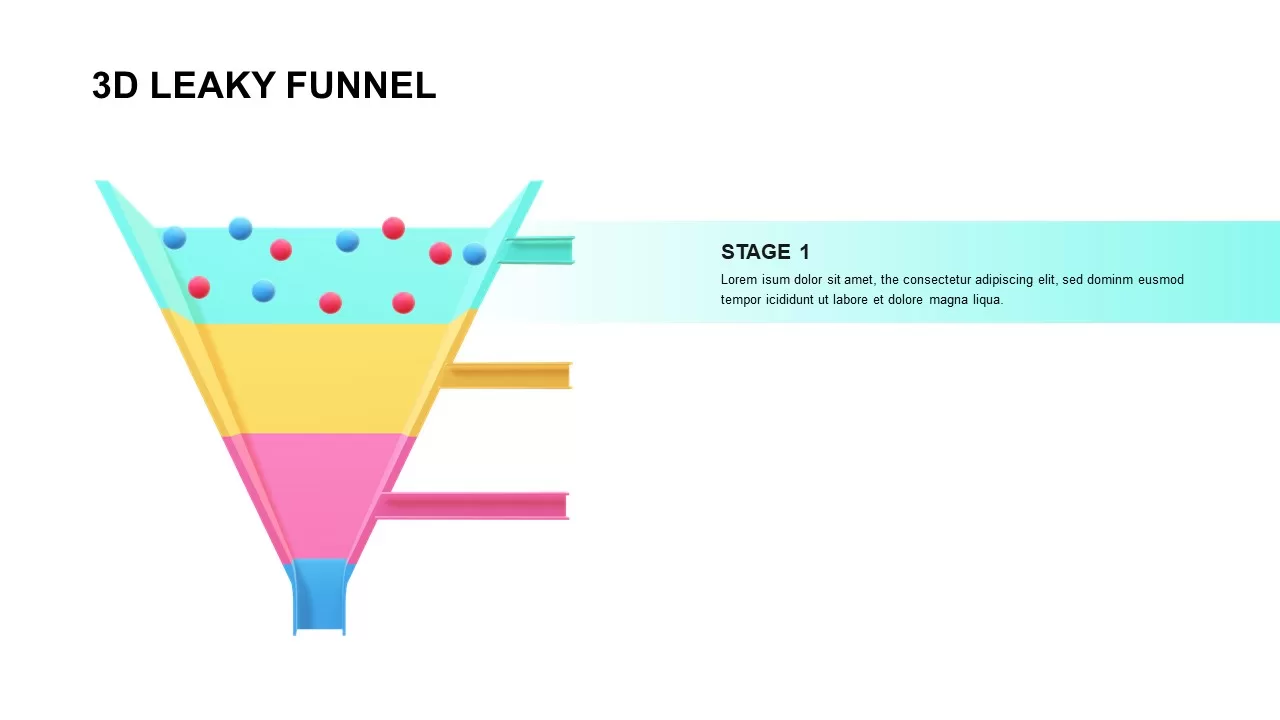
3d funnel leaky template


The 3D Leaky Funnel Diagram slide offers a visually engaging way to illustrate the stages of a process where items, data, or opportunities "leak" or drop off along the way. This funnel is represented with vibrant colors—blue, yellow, and pink—to visually demonstrate the flow and attrition rate at each stage. Ideal for showcasing marketing funnels, sales processes, or conversion paths, this diagram helps to communicate how potential leads or opportunities are lost throughout different stages.
With its 3D design and dynamic color palette, the slide not only captures attention but also makes it easy to track key metrics and identify bottlenecks or inefficiencies in a process. Each section of the funnel can be customized to represent different stages, and the leakage points can be used to symbolize lost opportunities or drop-off rates. Whether you’re presenting a sales pipeline, customer journey, or project lifecycle, this template offers clarity and insight into process flow.
This slide is perfect for presentations focused on performance analysis, strategy meetings, or process optimization. If you’d like to explore more designs, you can check out a wide range of funnel presentation templates available for different business needs.
Who is it for
This slide is designed for sales managers, marketers, project managers, and data analysts who need to present process flows, sales funnels, or project milestones. It is particularly useful for teams focused on improving conversion rates or identifying points of friction within a process.
Other Uses
Beyond sales or marketing, this diagram can be adapted to represent customer journeys, workflow processes, lead generation strategies, or even data analytics, making it a versatile tool for a range of industries. It can also be used to visualize any situation where items or processes diminish as they progress through various stages. For workflows involving filtering or step-by-step refinement, the funnel filter diagram and 3D funnel strategy diagram are another two great options to clearly illustrate multi-stage processes.
Login to download this file


