


Showing results for ""
Showing 8786-8820 out of 10000
-

Editable Multi-Series Peak Line Chart Template for PowerPoint & Google Slides
Comparison Chart
-
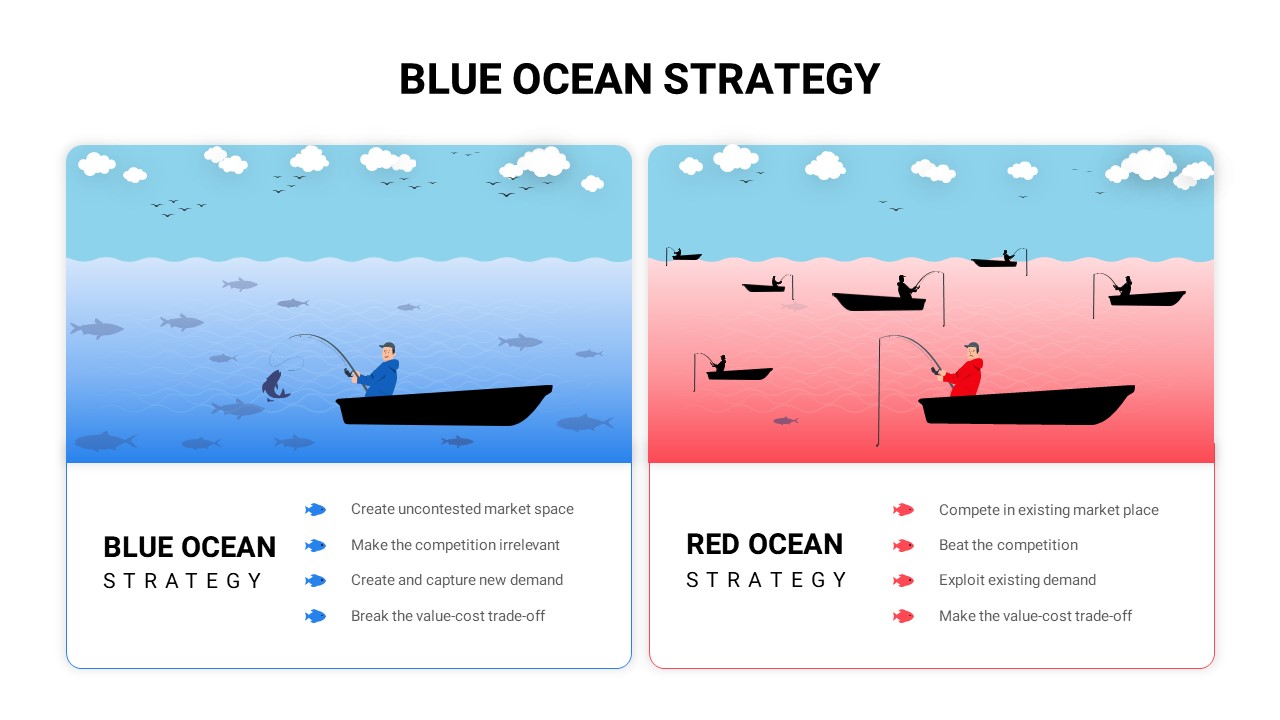
Blue vs Red Ocean Strategy Comparison Template for PowerPoint & Google Slides
Business Strategy
-
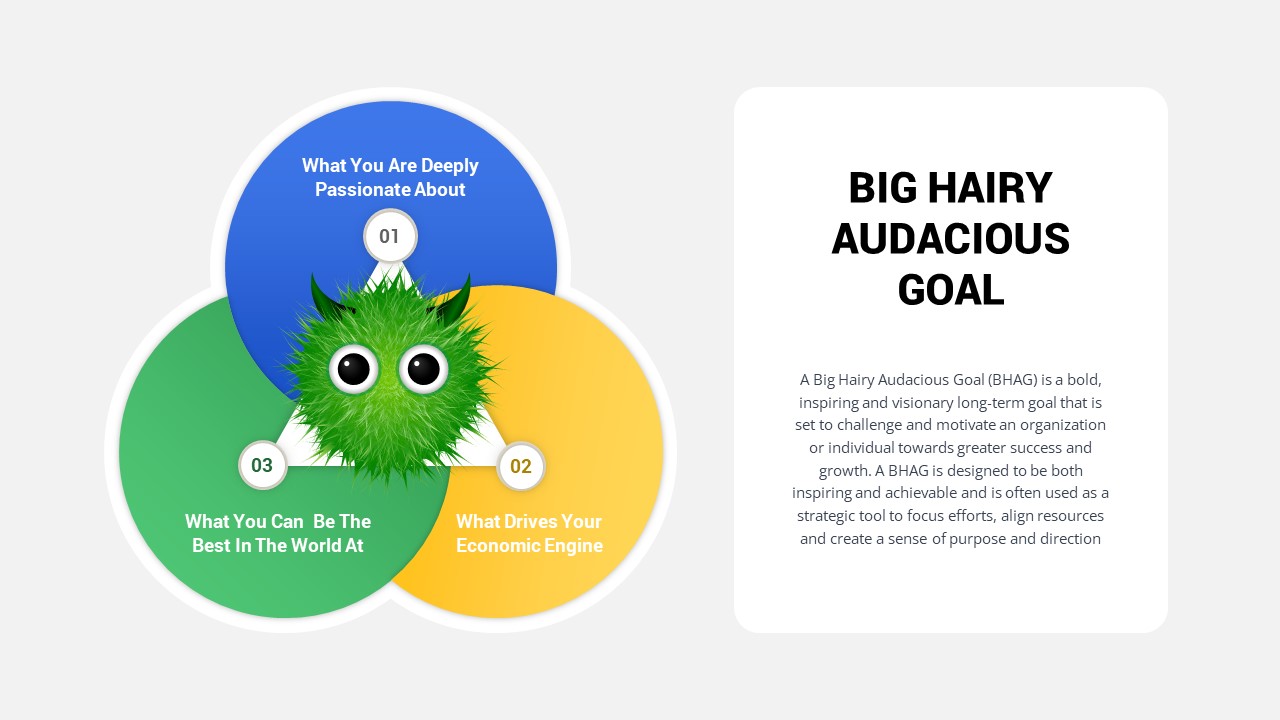
Big Hairy Audacious Goal Venn Diagram Template for PowerPoint & Google Slides
Circle
-

Monthly Recurring Revenue KPI Bar Chart Template for PowerPoint & Google Slides
Bar/Column
-
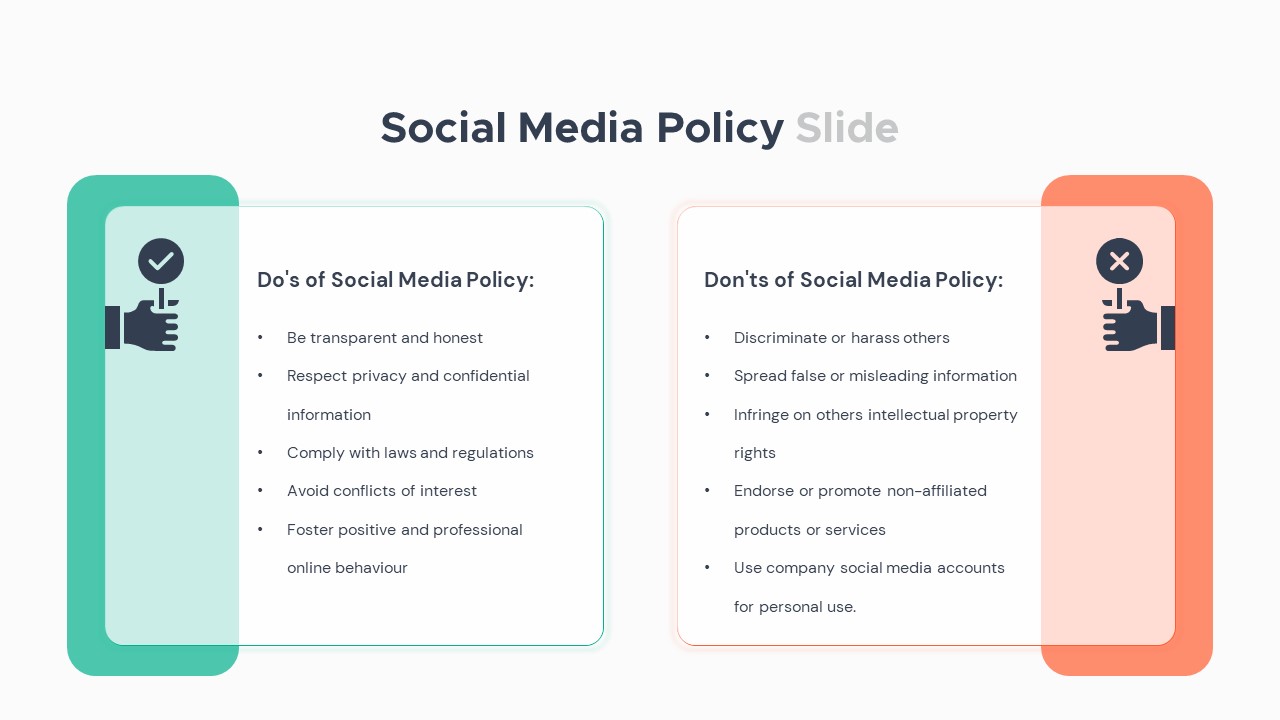
Social Media Policy Dos & Don’ts Slide Template for PowerPoint & Google Slides
Comparison
-
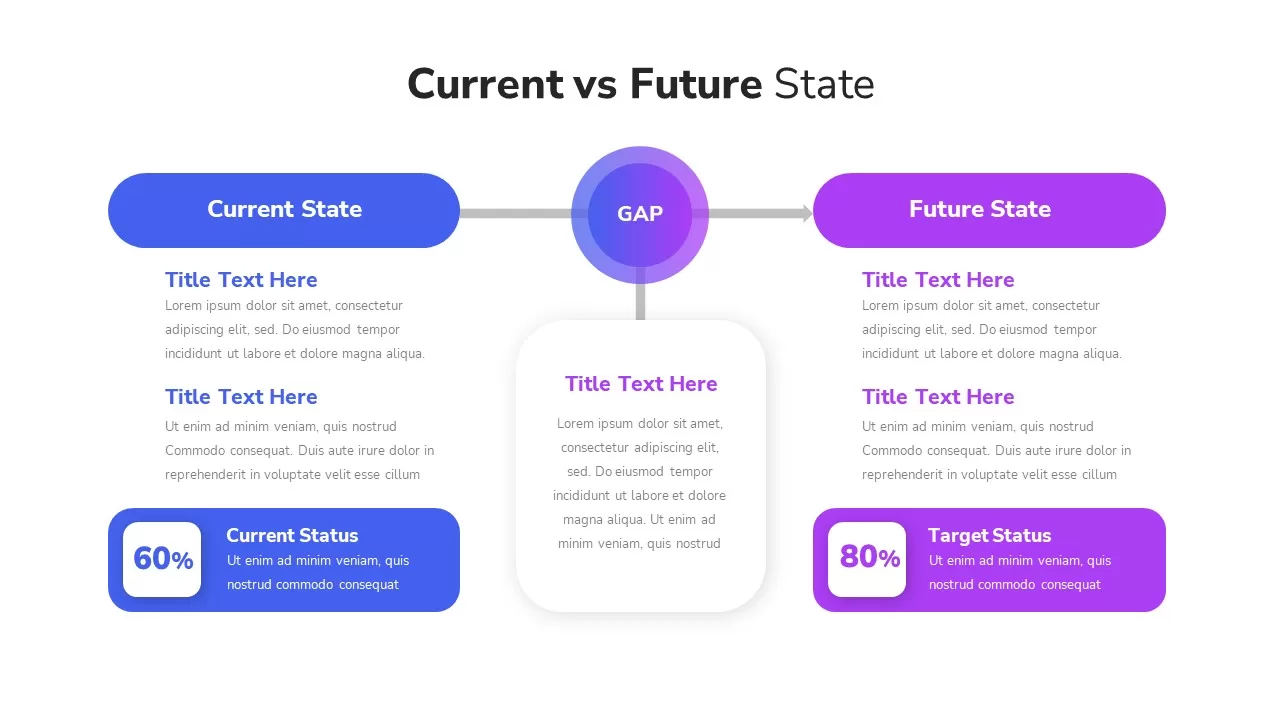
Current vs Future State Gap Analysis template for PowerPoint & Google Slides
Comparison
-

Current vs Future State Comparison Slide Template for PowerPoint & Google Slides
Comparison Chart
-
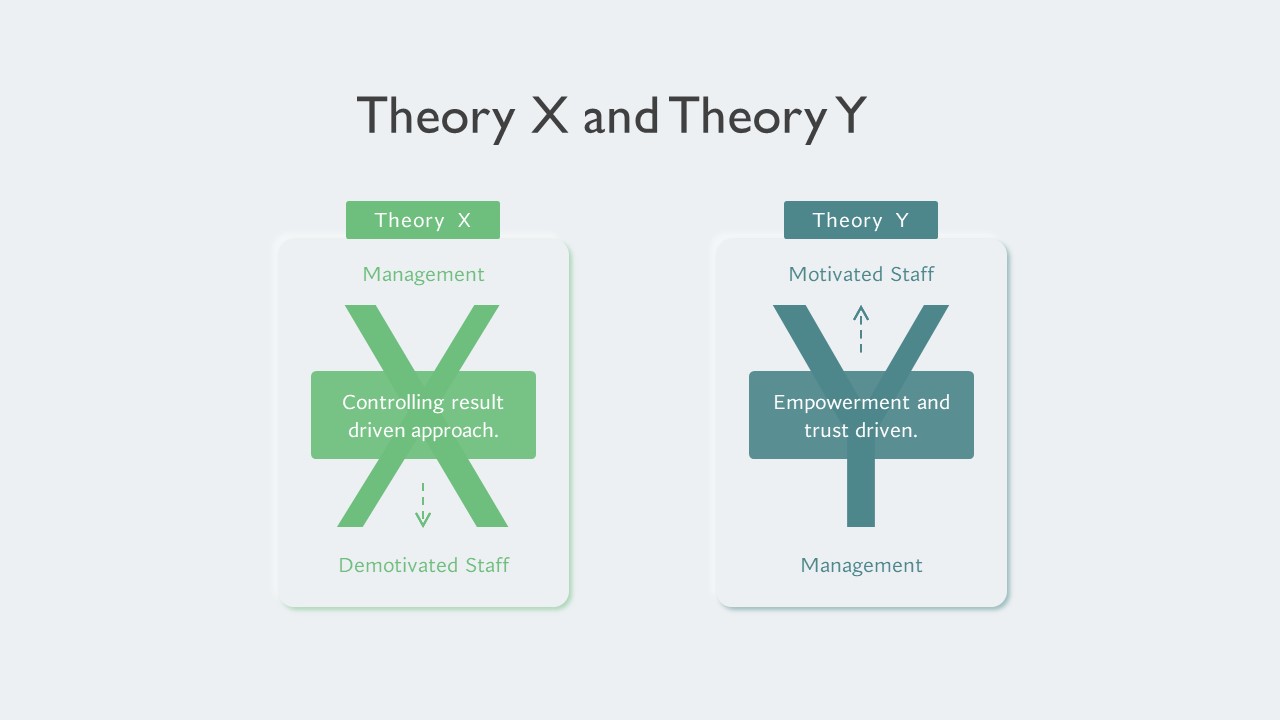
McGregor’s Theory X and Theory Y infographic Template for PowerPoint & Google Slides
Business Strategy
-

Sky and Tree Root Cause Analysis Deck Template for PowerPoint & Google Slides
Opportunities Challenges
-
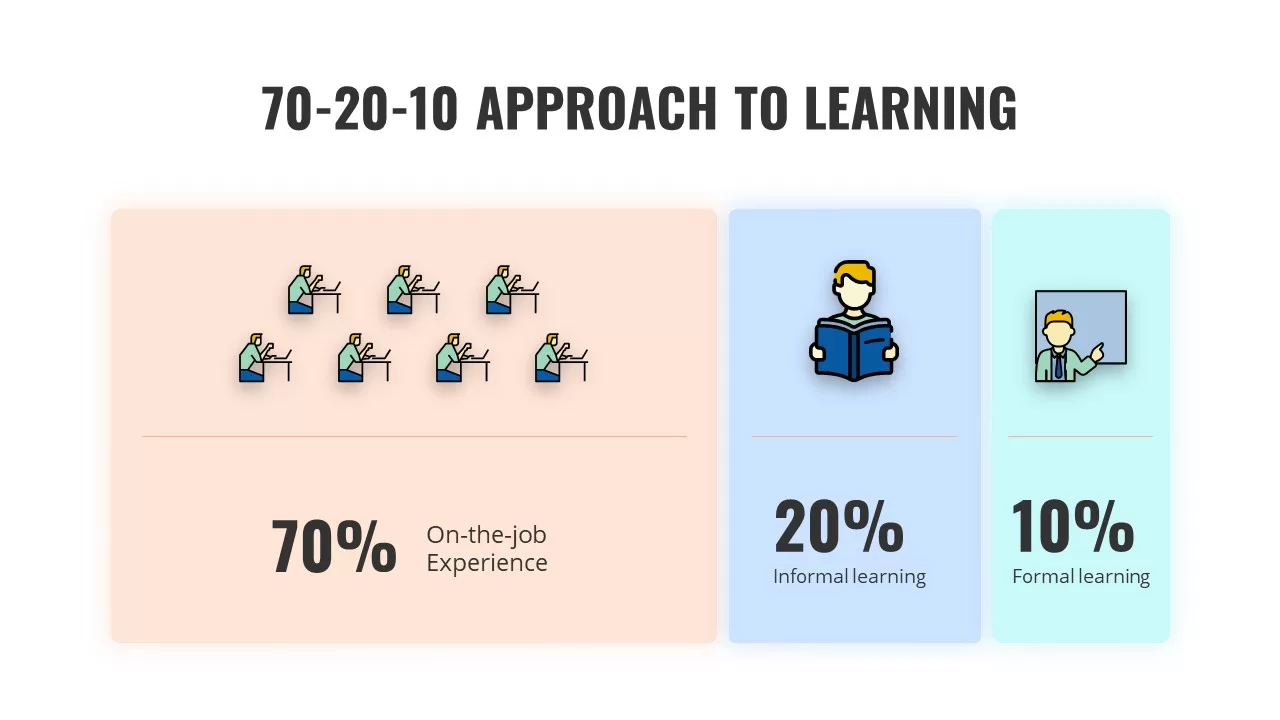
70-20-10 Learning Approach Infographic Template for PowerPoint & Google Slides
Process
-

Sales Growth Dashboard: KPI Gauge & Line Template for PowerPoint & Google Slides
Revenue
-

North Korea Map with Provinces Infographic Pack Template for PowerPoint & Google Slides
Maps
-

Interactive US Population Data Map Slide Template for PowerPoint & Google Slides
World Maps
-
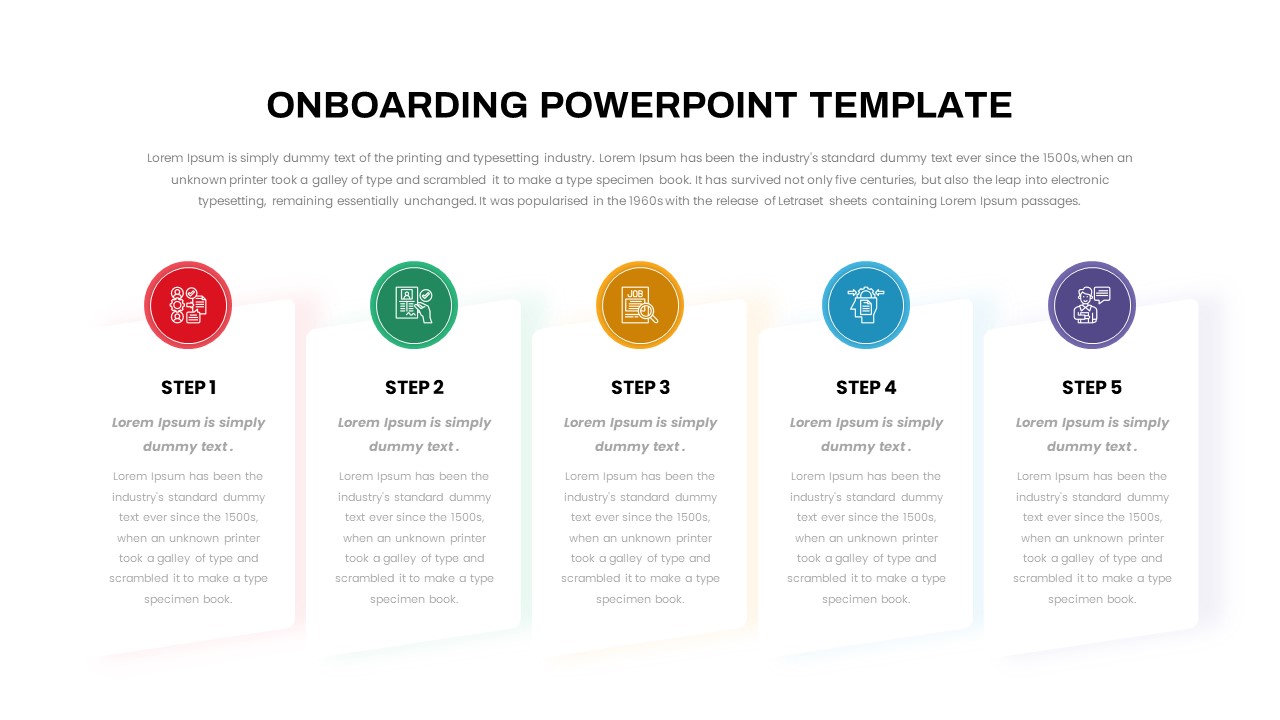
Free Five-Step Employee Onboarding Process Template for PowerPoint & Google Slides
Recruitment
Free
-
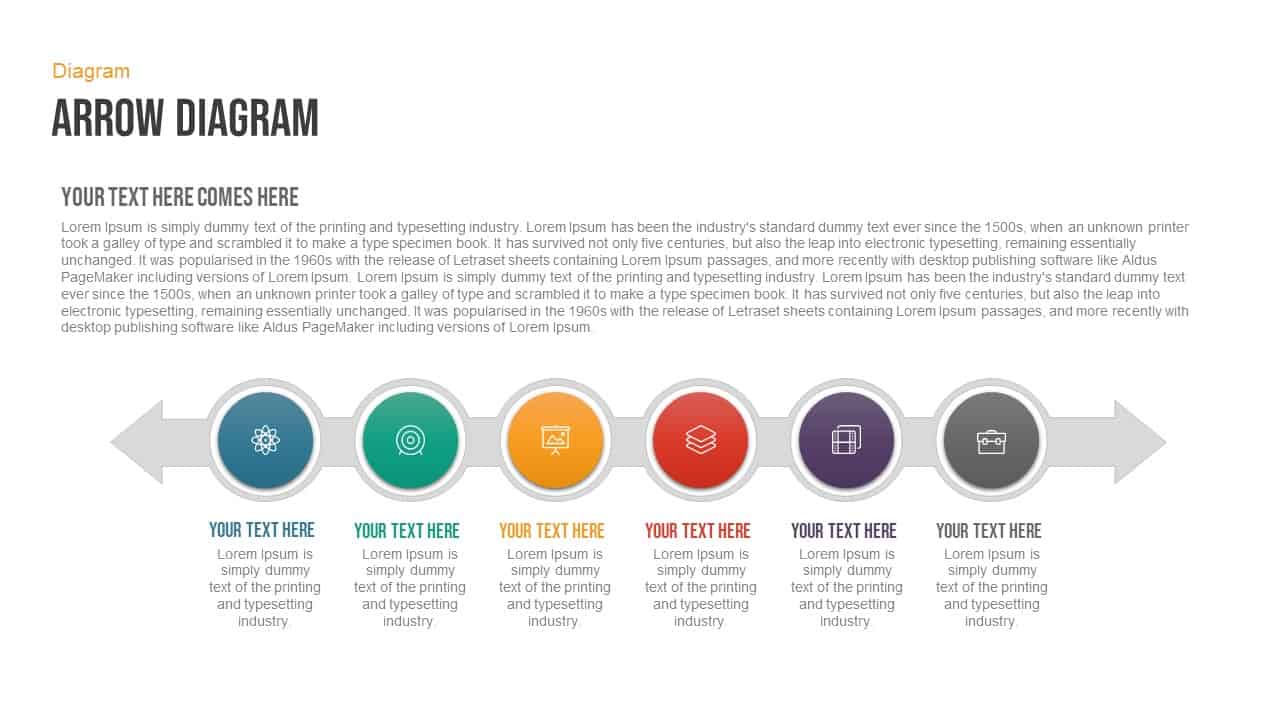
Free Six-Stage Arrow Process Diagram Template for PowerPoint & Google Slides
Process
Free
-
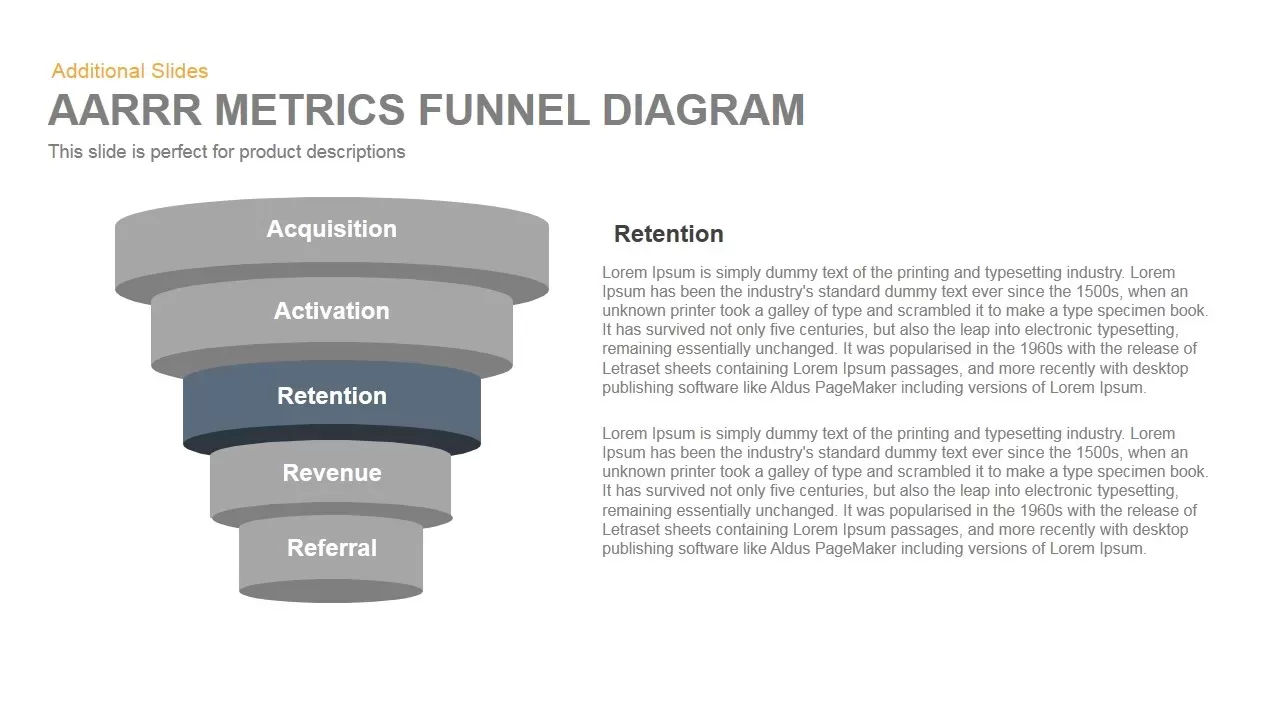
Aarrr Metrics Funnel Diagram Powerpoint Keynote 3
Funnel
-
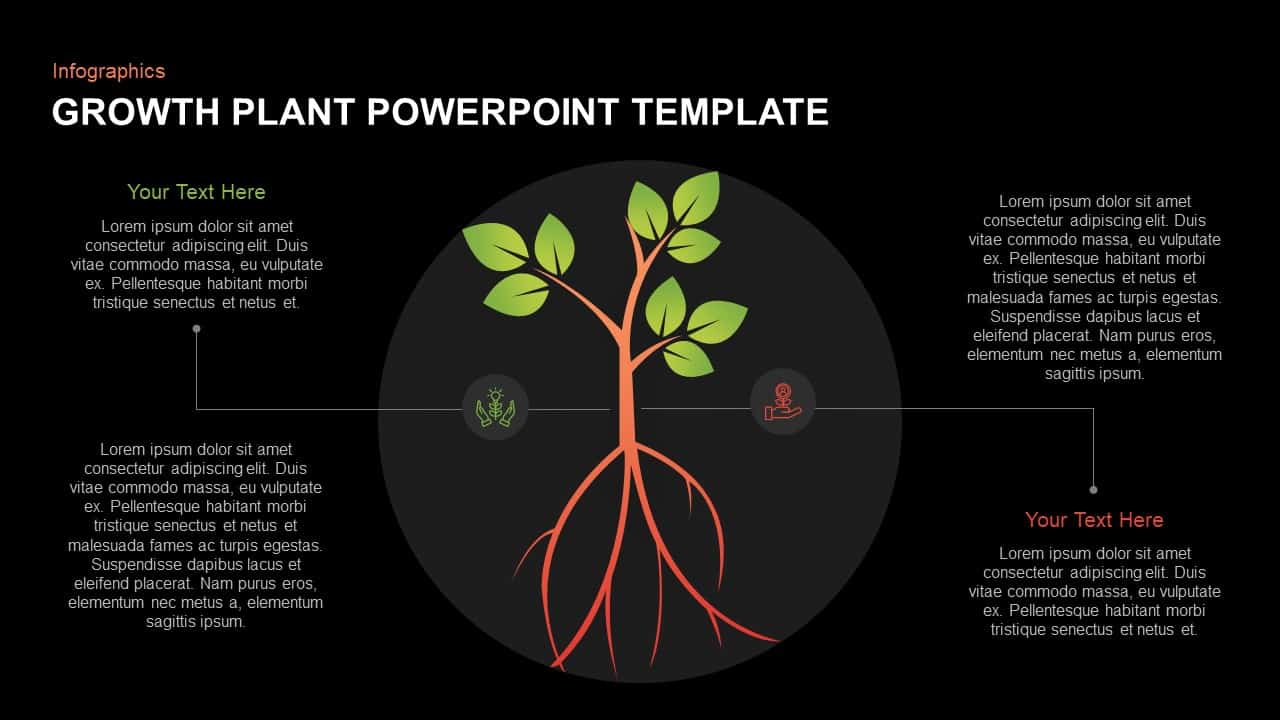
Growth Plant Source PowerPoint and Keynote Slide-1
Process
-
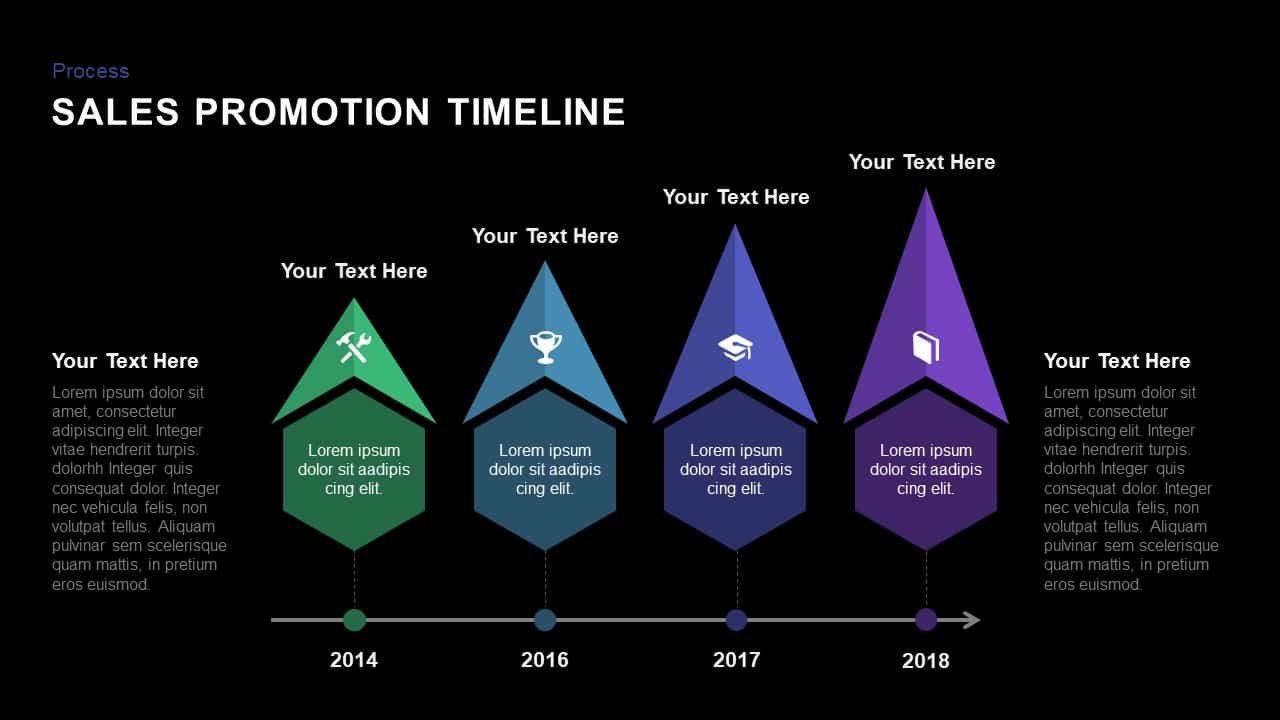
Sales Promotion Timeline PowerPoint And Keynote Slides-1
Timeline
-

Simple Business Deck PPT Thankyou Template Slide For Presentations
Company Profile
-
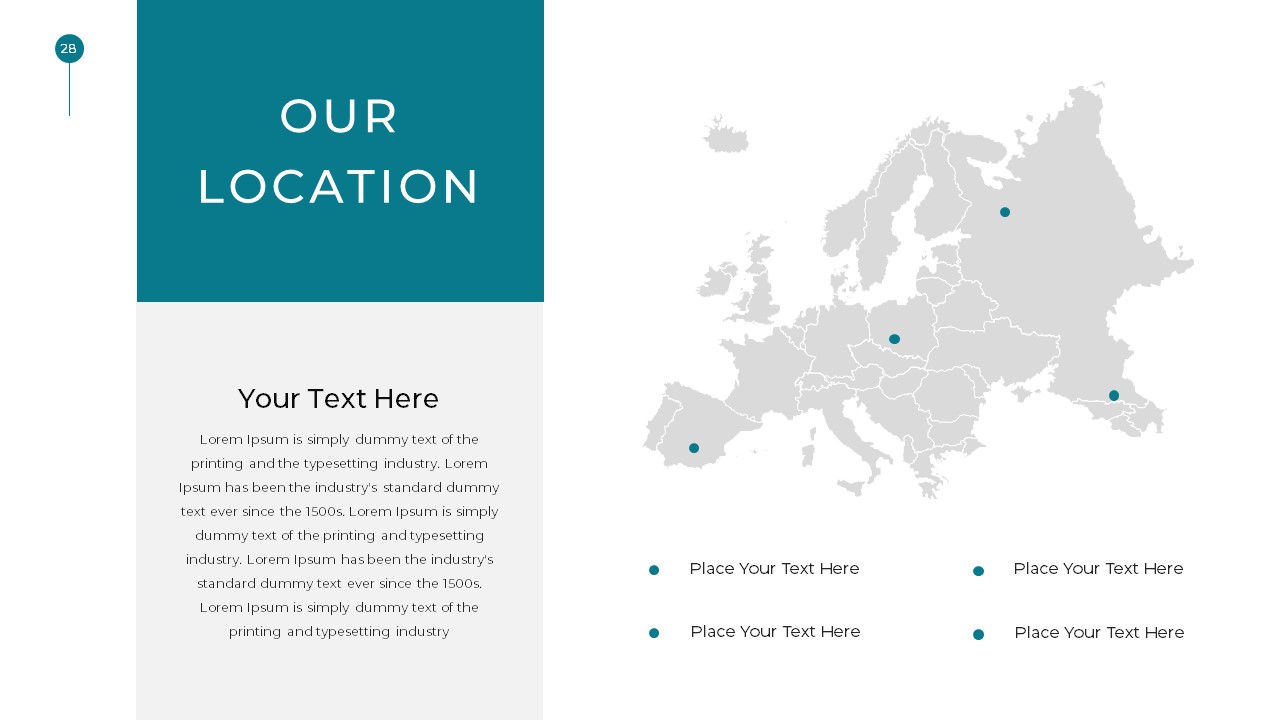
Simple Business Deck PPT Template Location Slide For Presentations
Company Profile
-
Simple Business Deck PPT Template Infographics Slide For Presentations
Company Profile
-
Simple Business Deck PPT Infographics Template Slide For Presentations
Company Profile
-
Simple Business Deck MockUp Template PPT Slide For Presentations
Company Profile
-
Simple Business Deck Infographics PPT Template Slide For Presentations
Company Profile
-
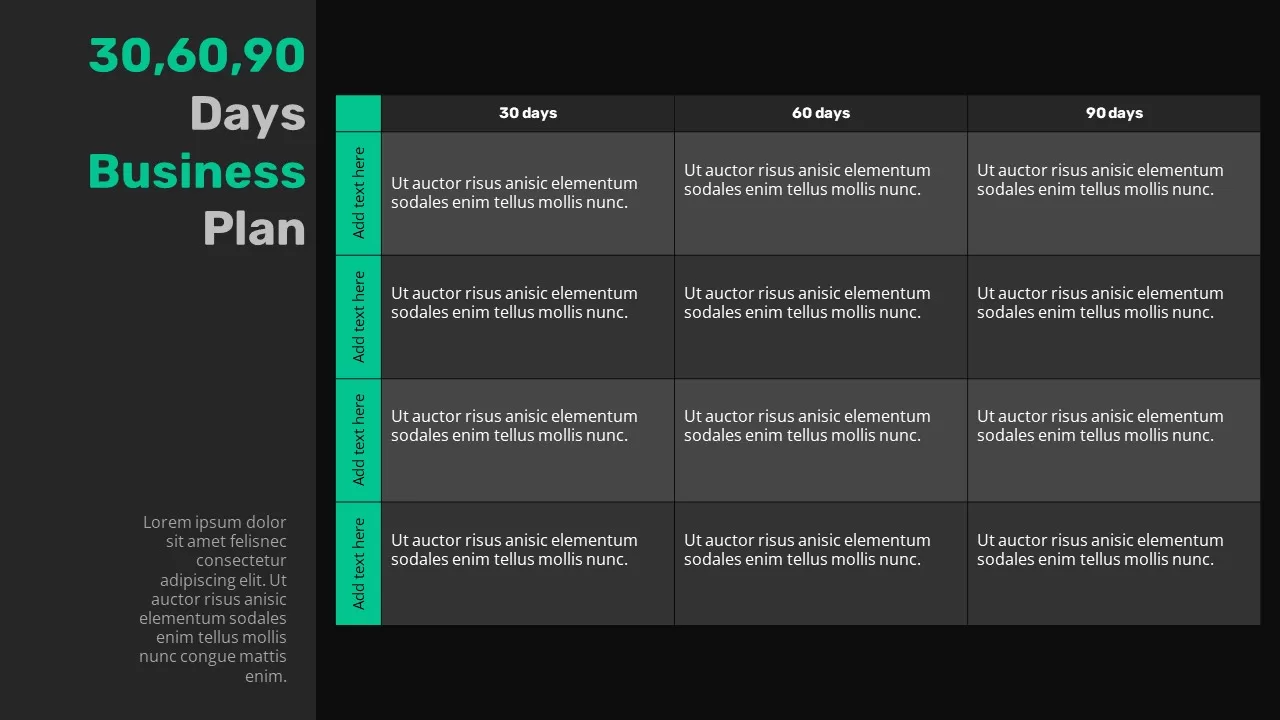
30 60 90 Days Business Plan Template Dark
Timeline
-
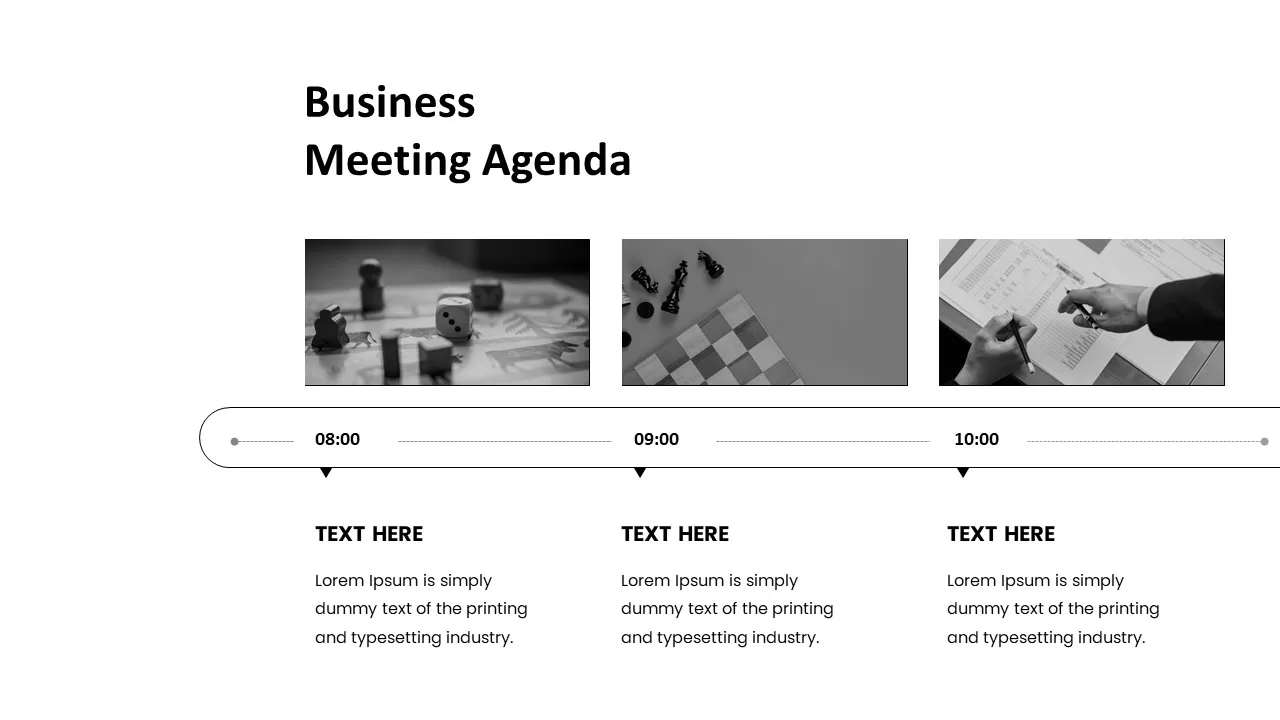
Black and White Meeting Agenda Template business time agenda
Company Profile
-

team member Black and White Business Plan Presentation Template
Pitch Deck
Free
-
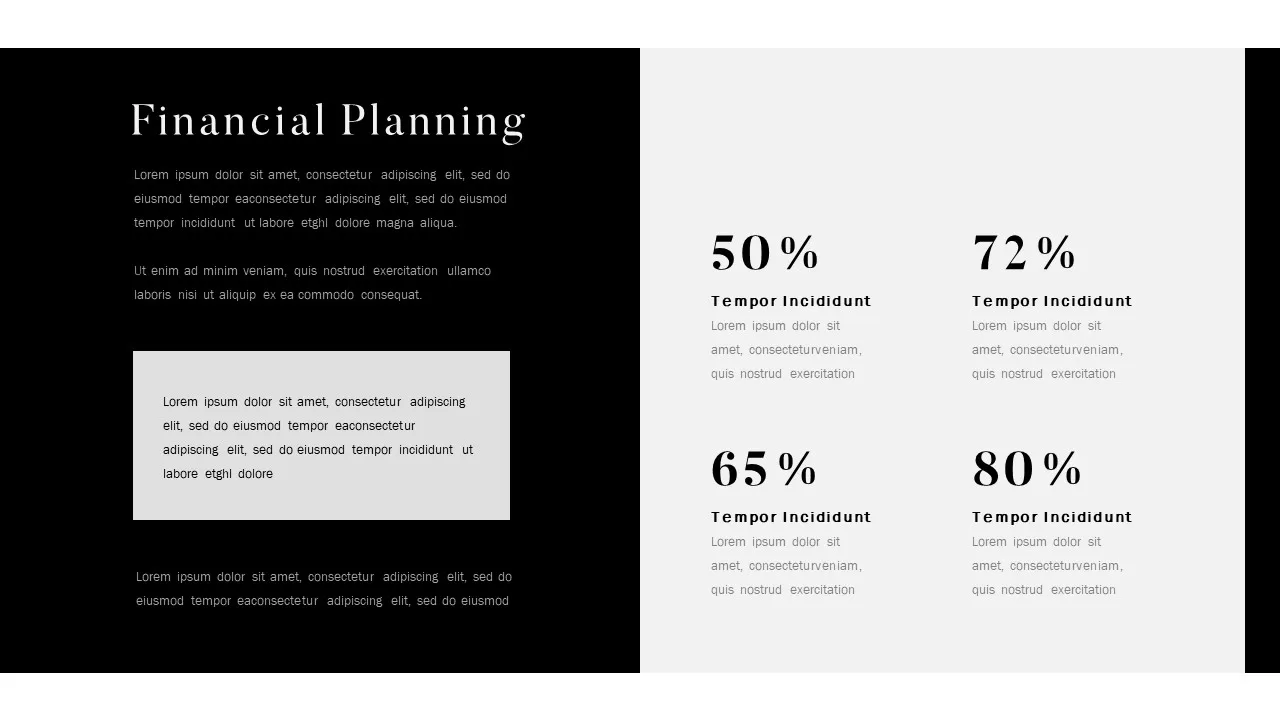
Financial Planning Black and White Business Plan Presentation Template
Pitch Deck
Free
-
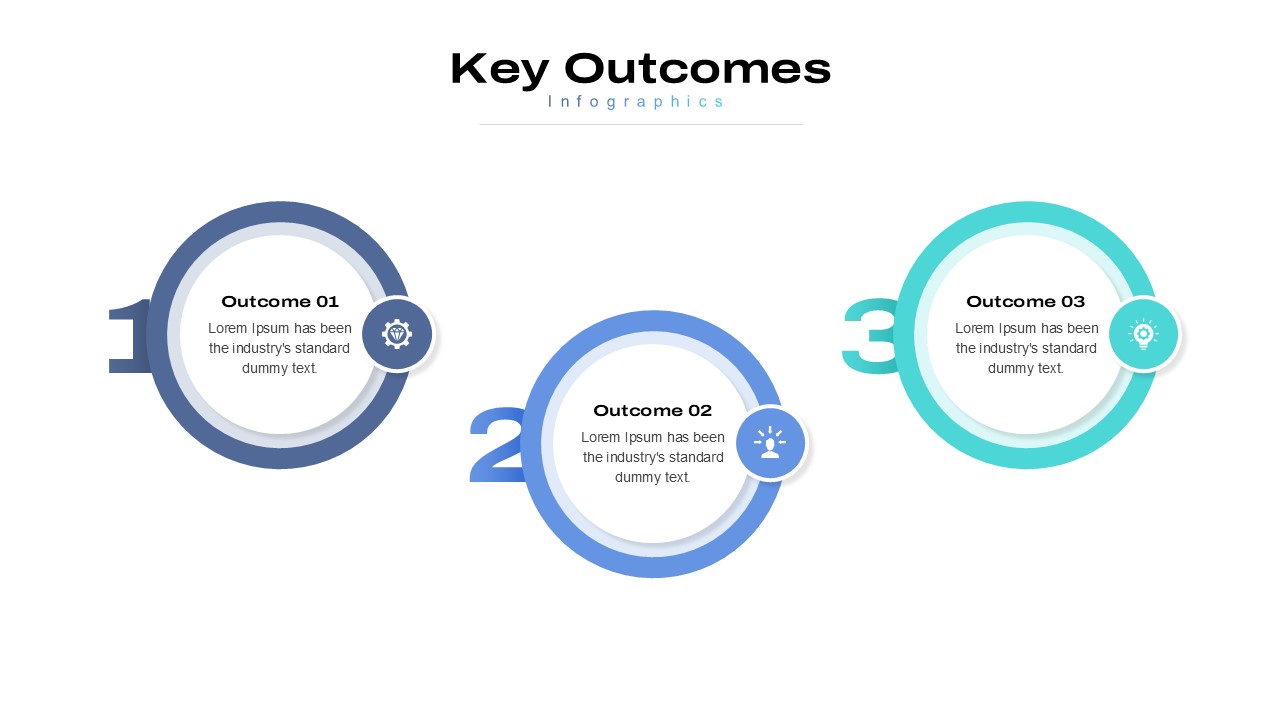
5 Styles Key Outcomes Infographics Pack Template for PowerPoint & Google Slides
Infographics
-
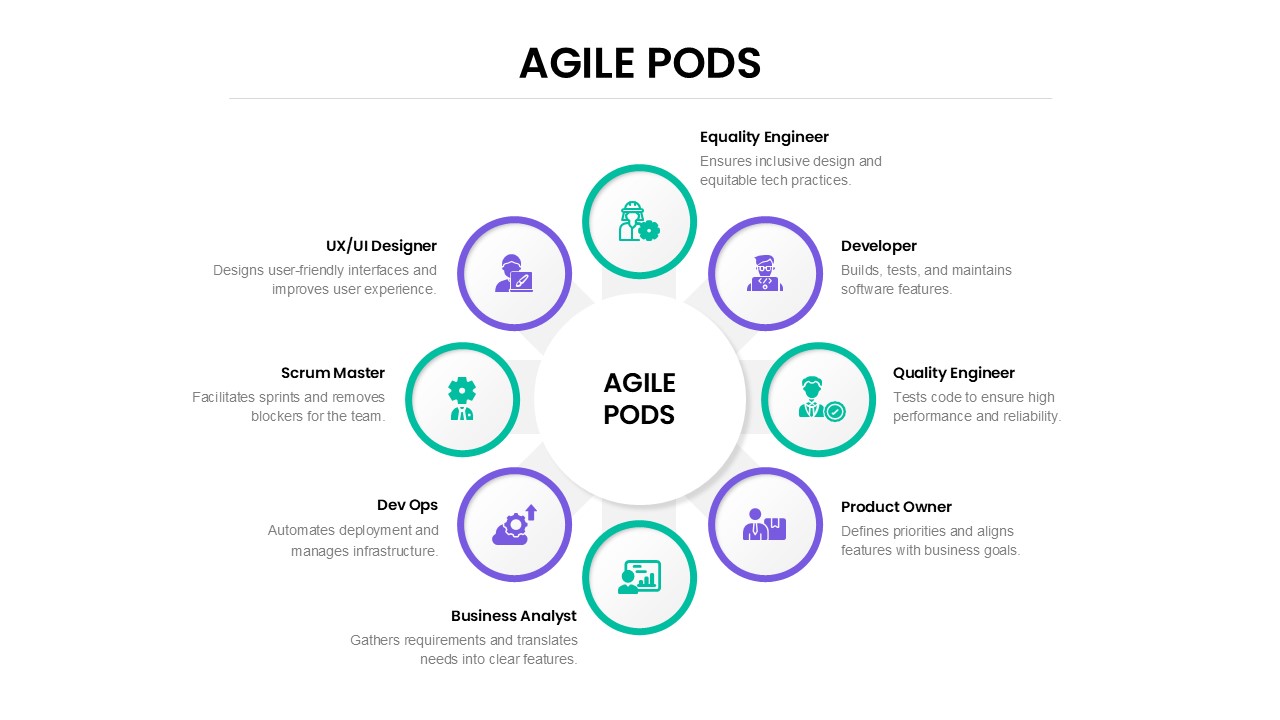
Agile Pods Team Roles Circular Diagram Template for PowerPoint & Google Slides
Circle
-

Cross Sell & Up Sell Strategy Comparison template for PowerPoint & Google Slides
Comparison
-
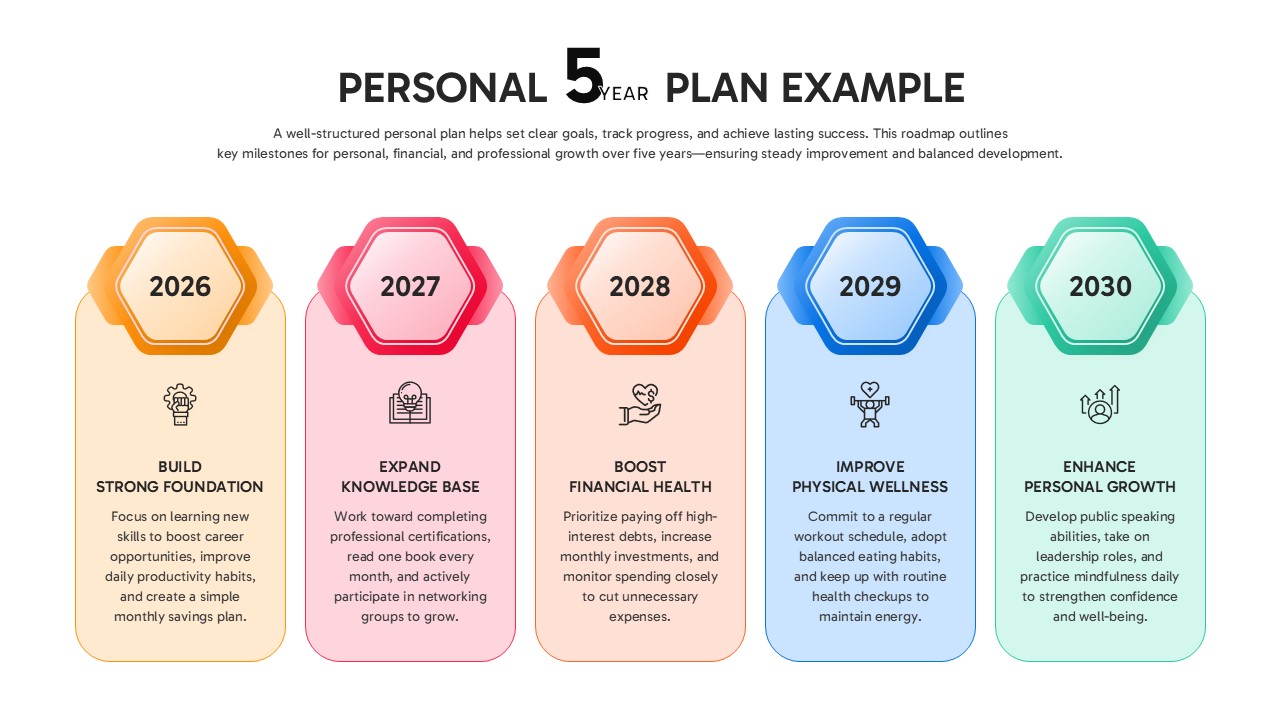
Personal 5-Year Roadmap Plan Example Template for PowerPoint & Google Slides
Timeline
-
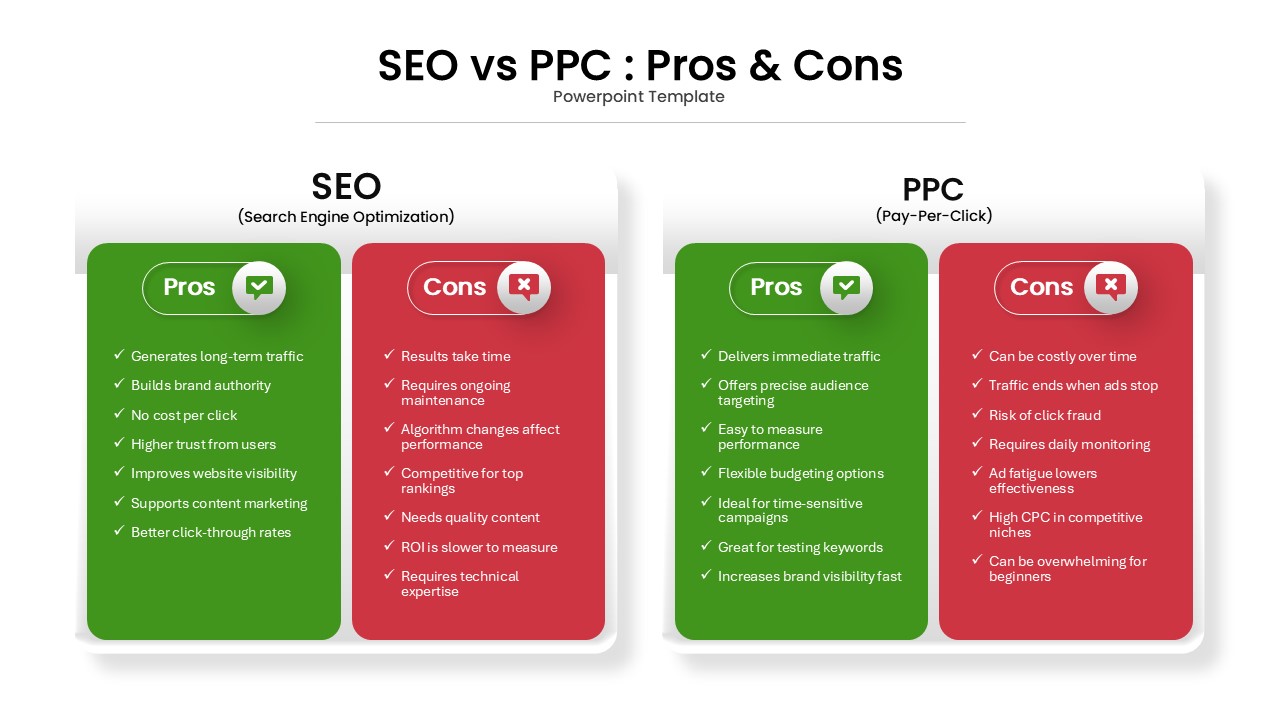
SEO vs PPC: Pros & Cons Comparison Template for PowerPoint & Google Slides
Comparison
-
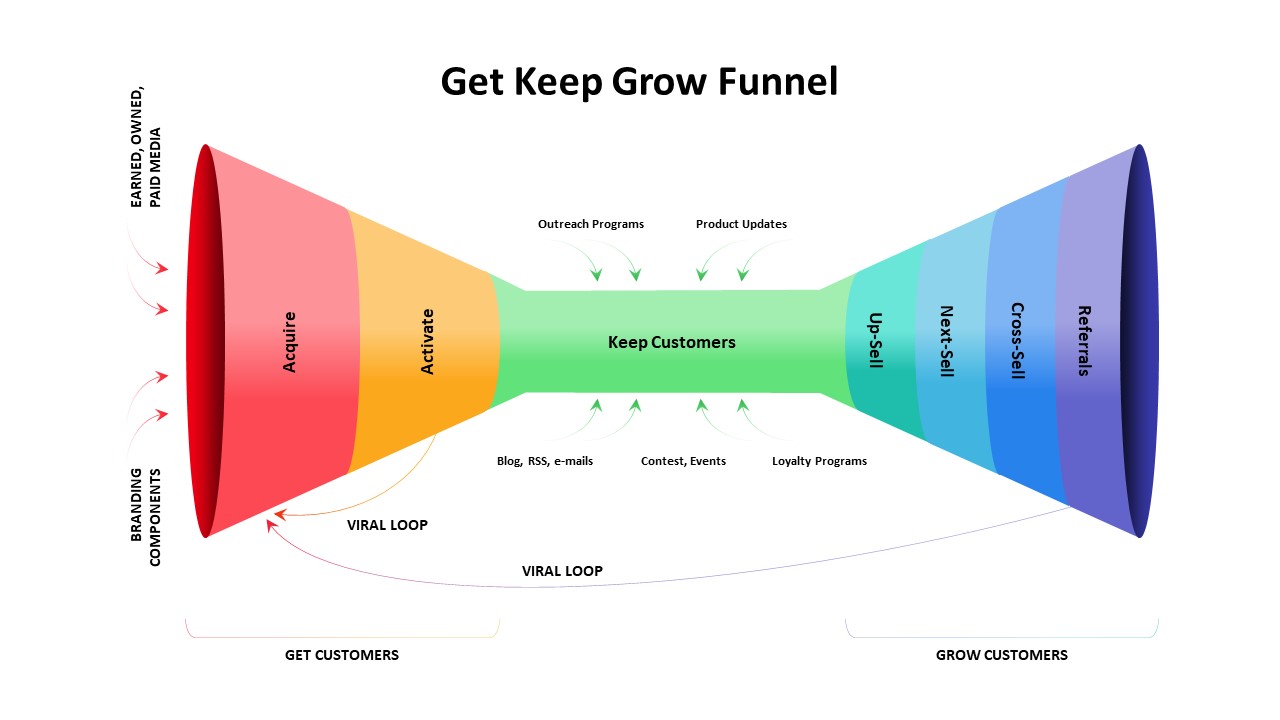
Get Keep Grow Customer Funnel Lifecycle Template for PowerPoint & Google Slides
Funnel
-
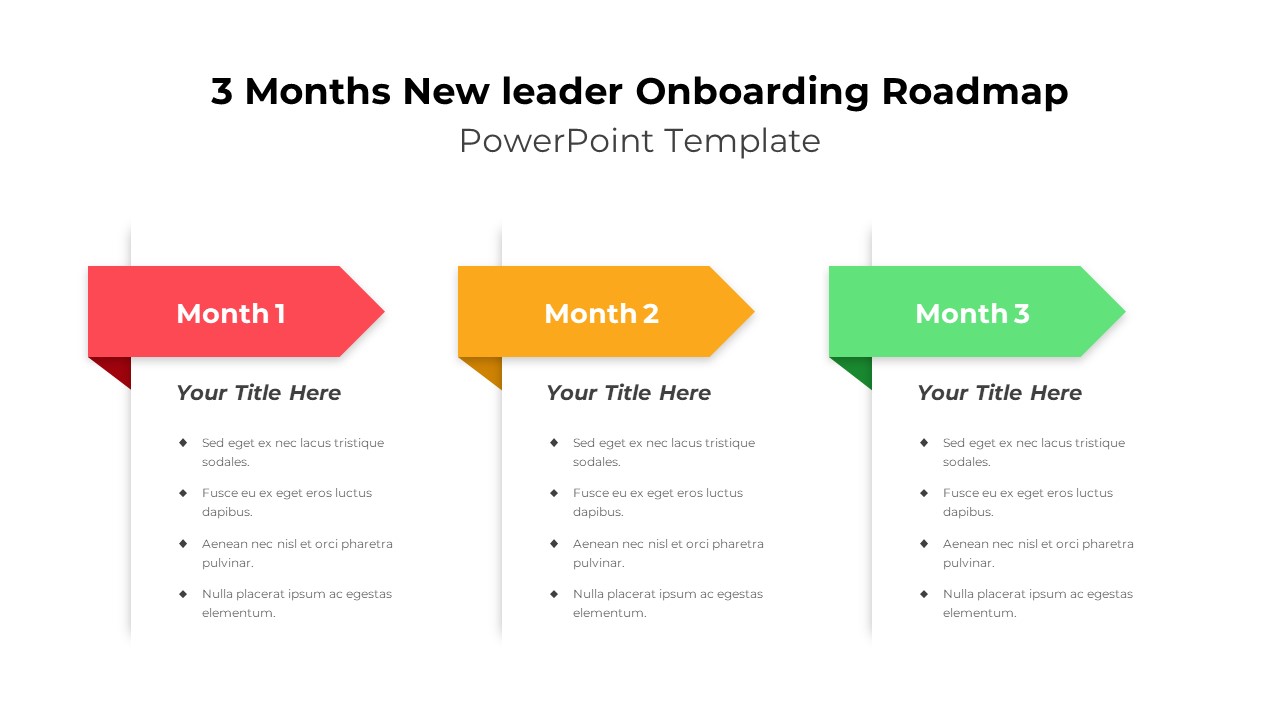
3 Months New Leader Onboarding Roadmap Template for PowerPoint & Google Slides
HR