


Showing results for ""
Showing 5356-5390 out of 10000
-
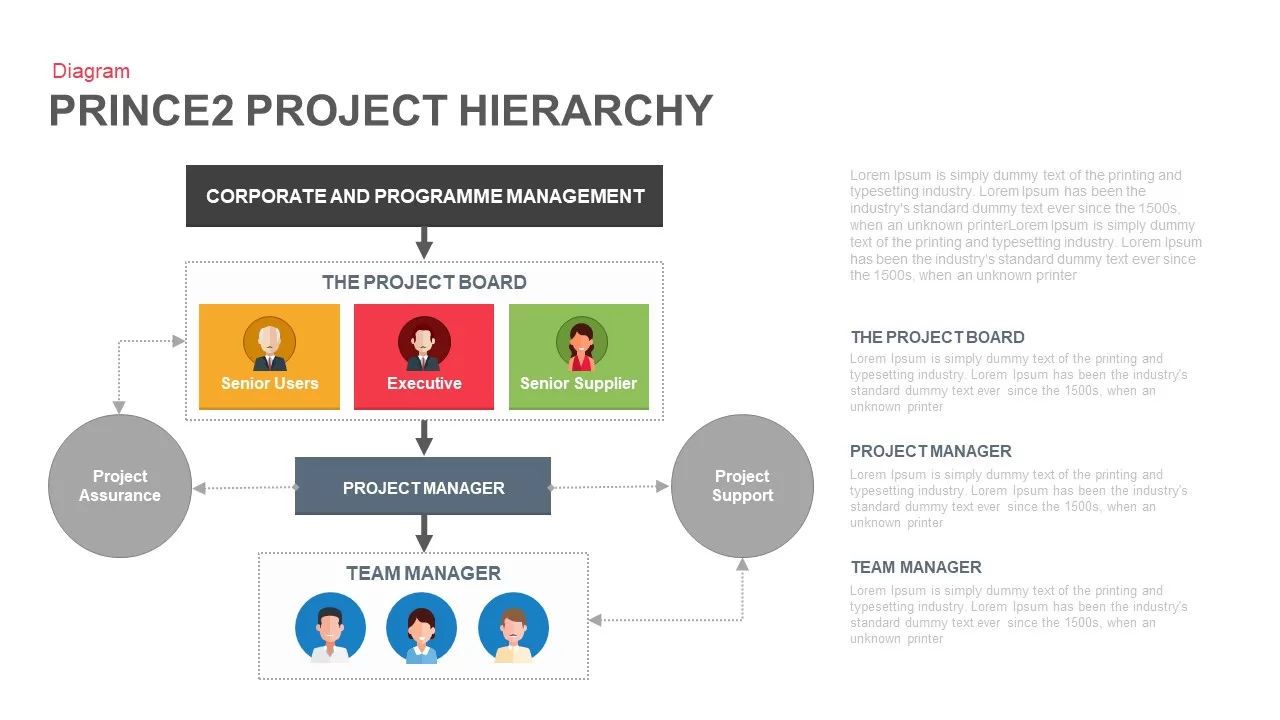
PRINCE2 Project Hierarchy Diagram for PowerPoint & Google Slides
Org Chart
-

Six Stage Timeline Diagram for PowerPoint & Google Slides
Timeline
-
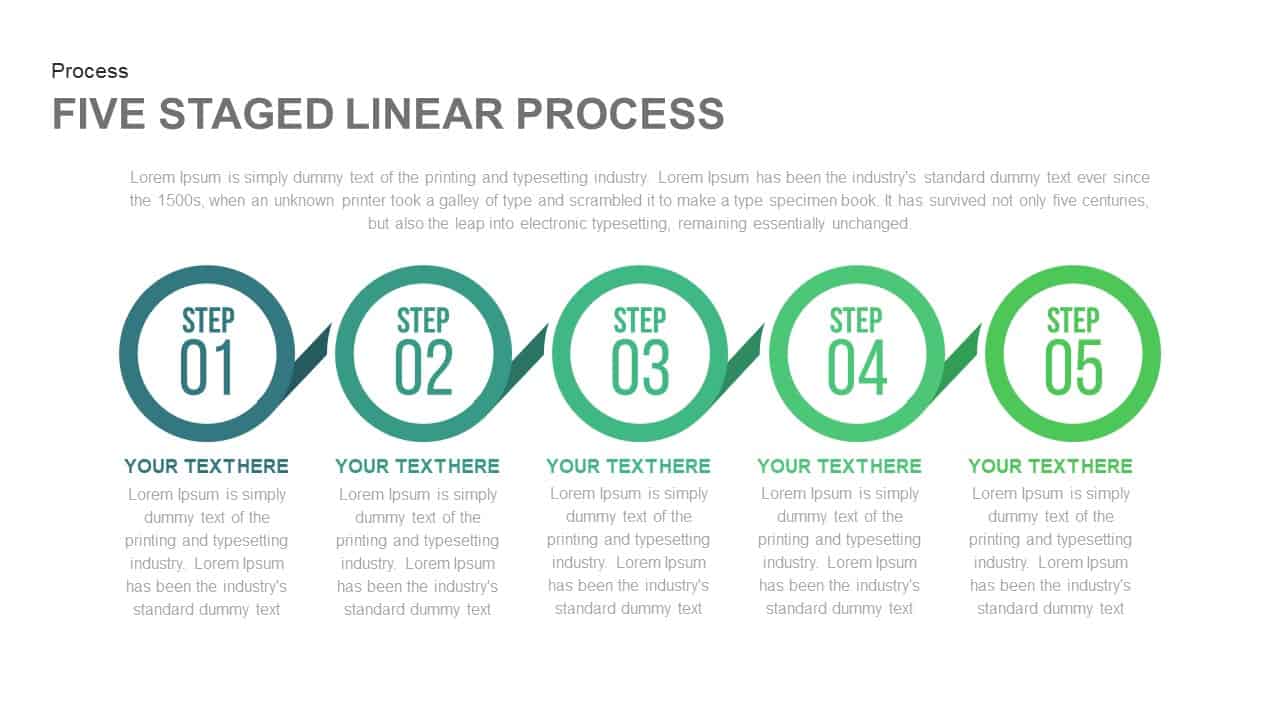
Five Staged Linear Process for PowerPoint & Google Slides
Process
-
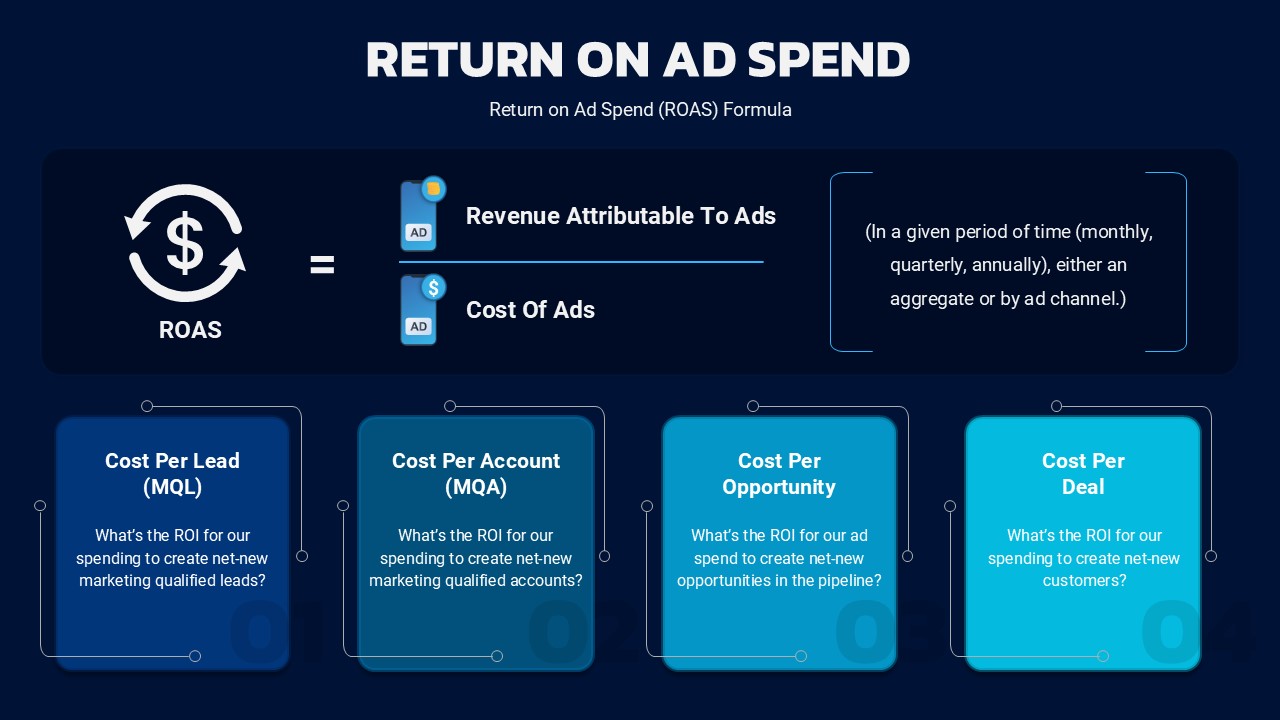
Return on Ad Spend Formula for PowerPoint & Google Slides
Business Strategy
-

Patient-Satisfaction KPI Dashboard for PowerPoint & Google Slides
Business
-
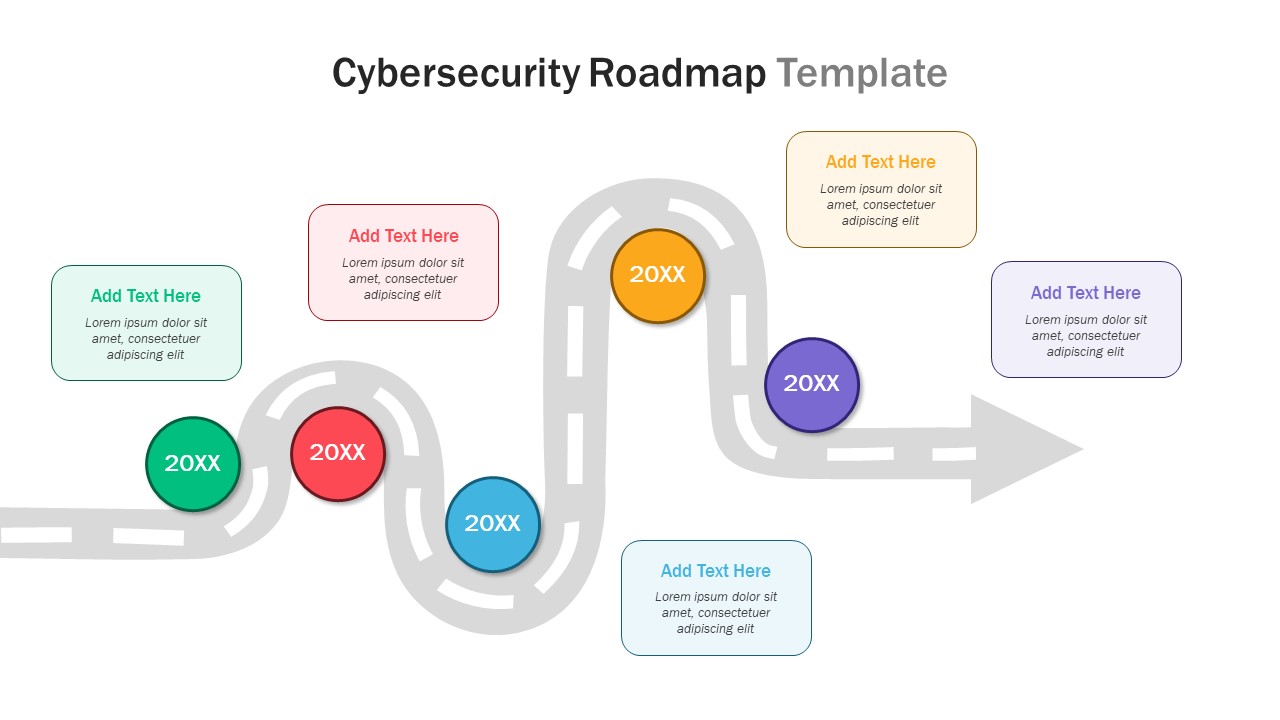
Cybersecurity Timeline Roadmap Slide for PowerPoint & Google Slides
Information Technology
-
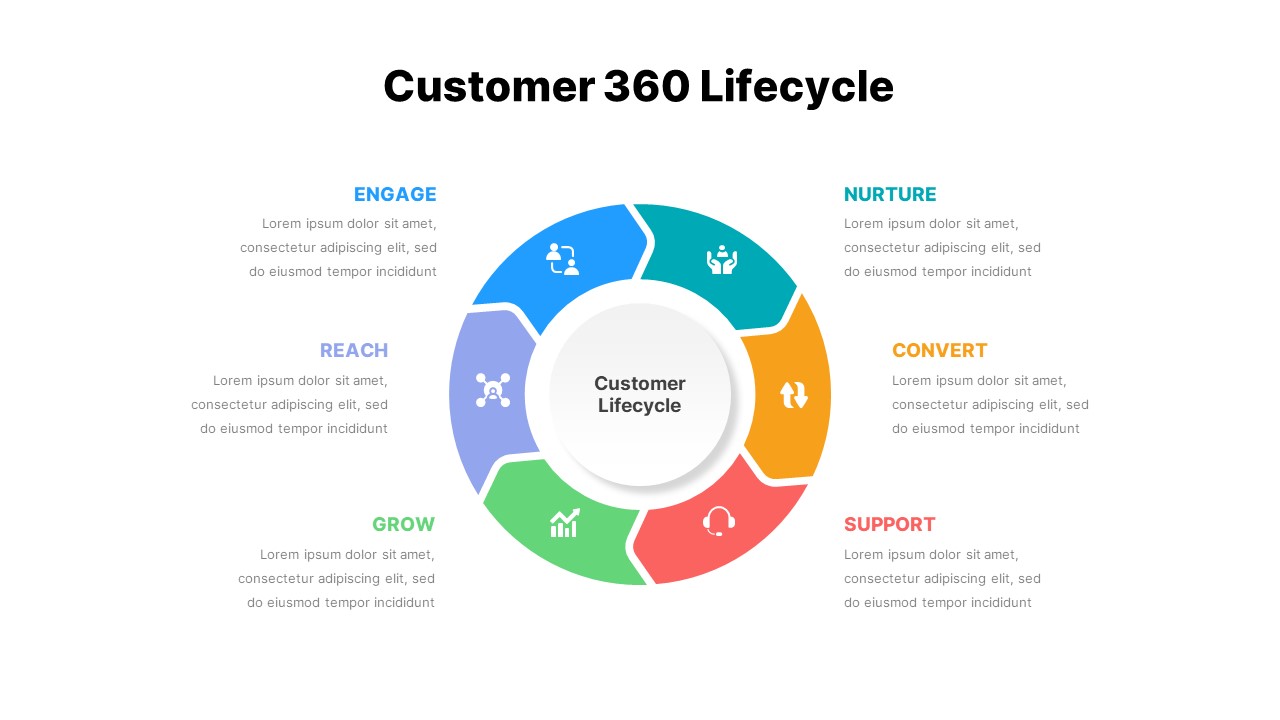
Customer 360 Lifecycle Slide for PowerPoint & Google Slides
Customer Journey
-

Corporate Management Strategy Deck for PowerPoint & Google Slides
Business Strategy
-
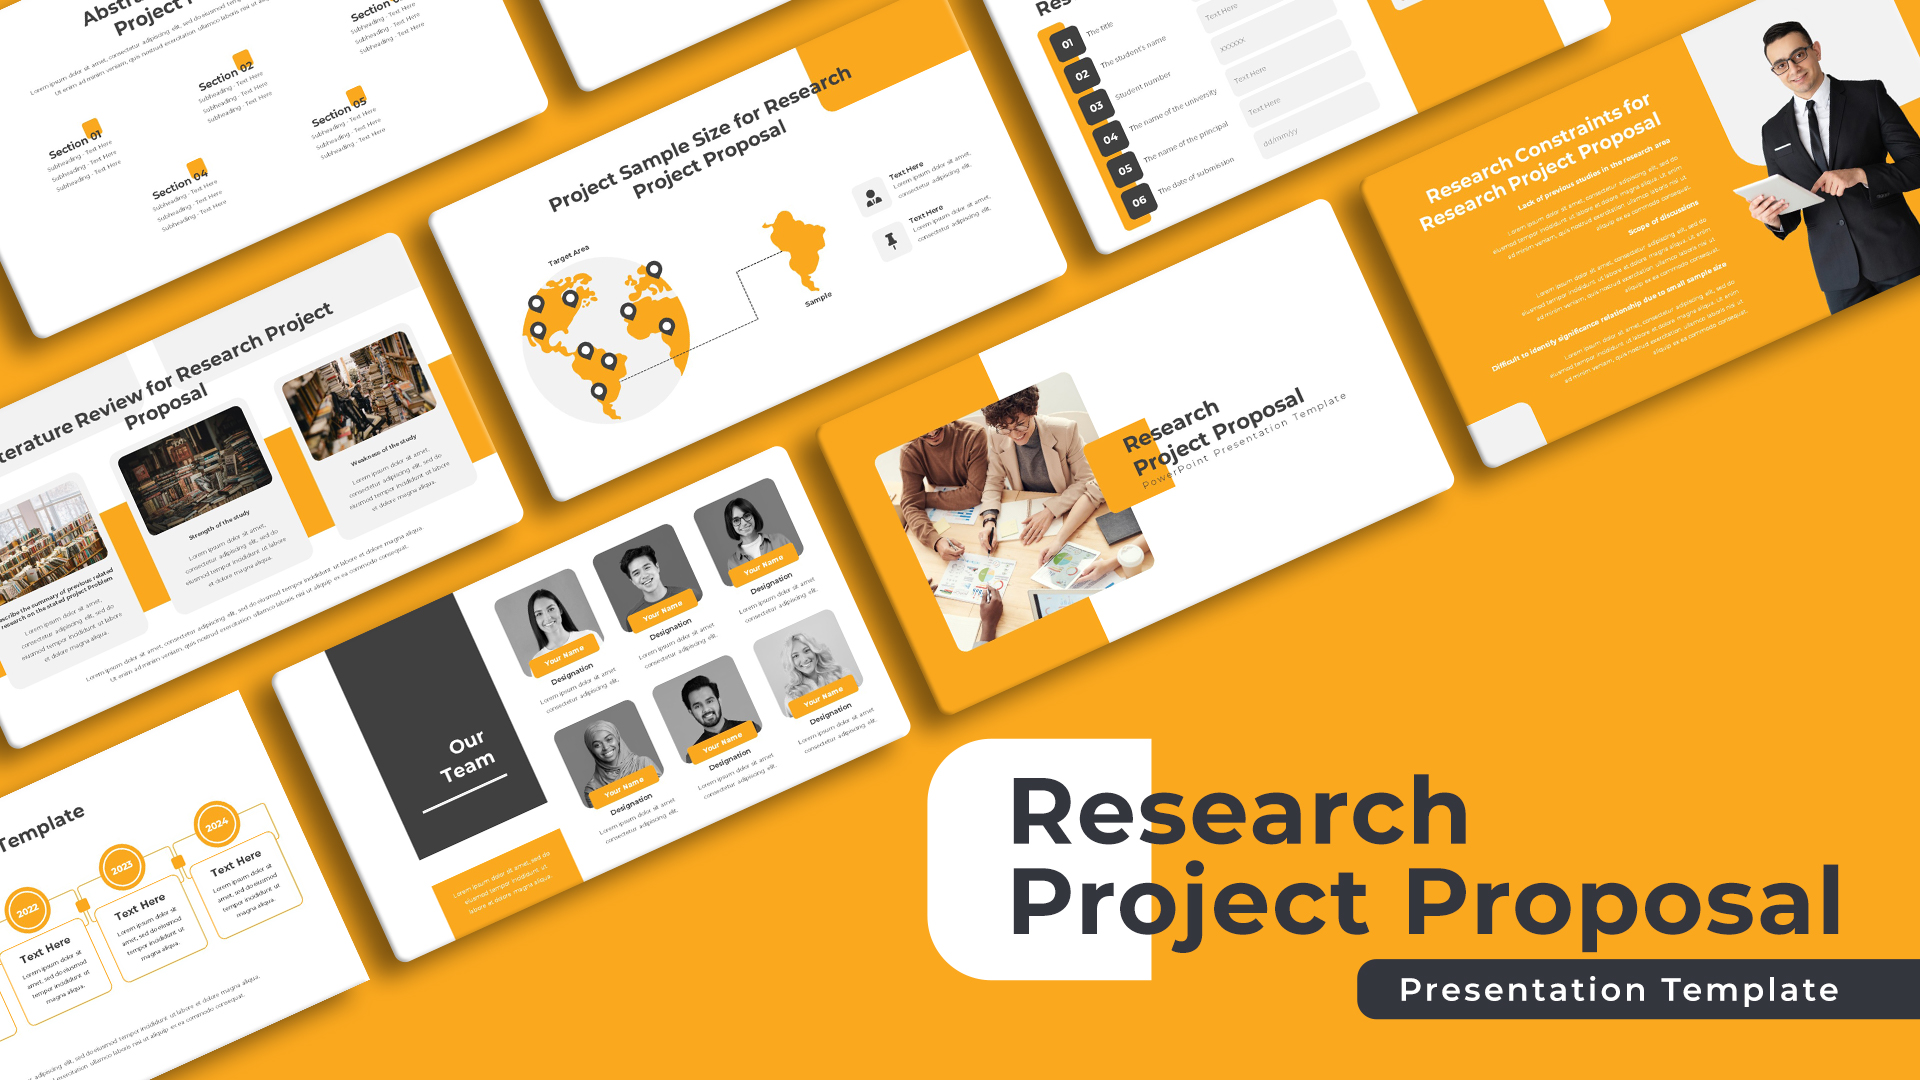
Research Project Proposal Deck for PowerPoint & Google Slides
Pitch Deck
-
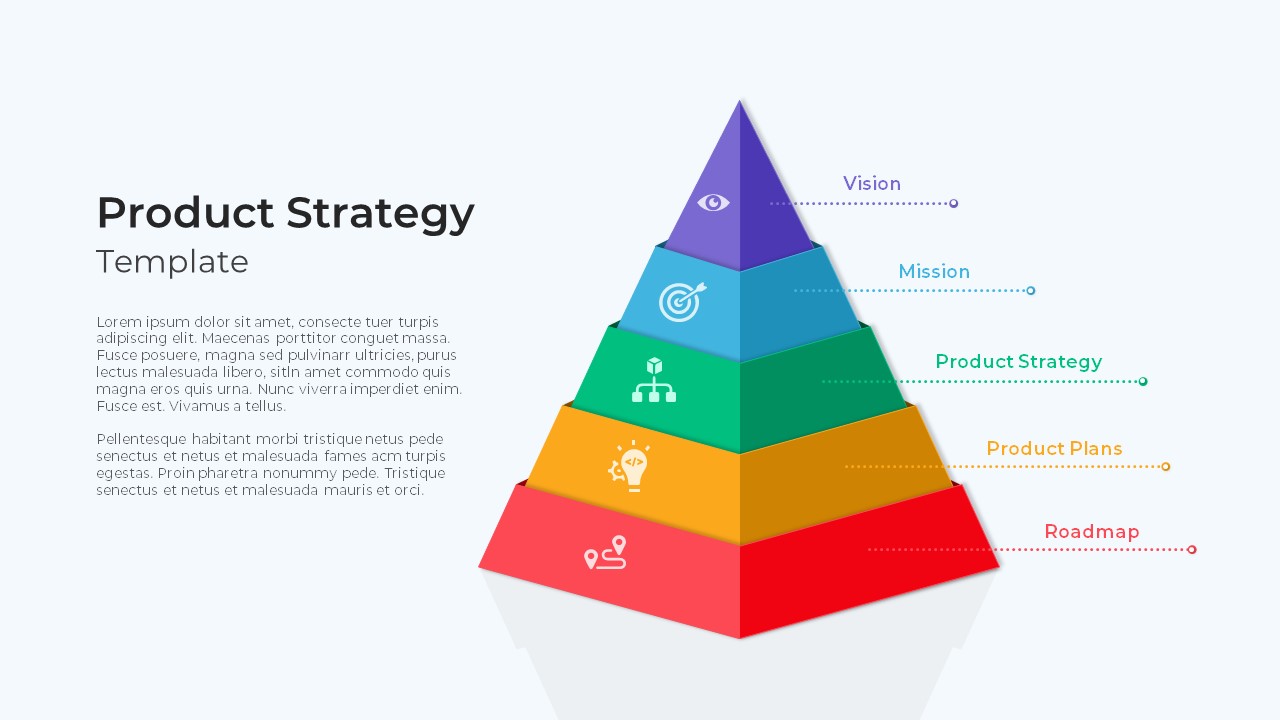
Product Strategy Pyramid Diagram for PowerPoint & Google Slides
Business Strategy
-

Engineering Maintenance Dashboard Slide for PowerPoint & Google Slides
Software Development
-
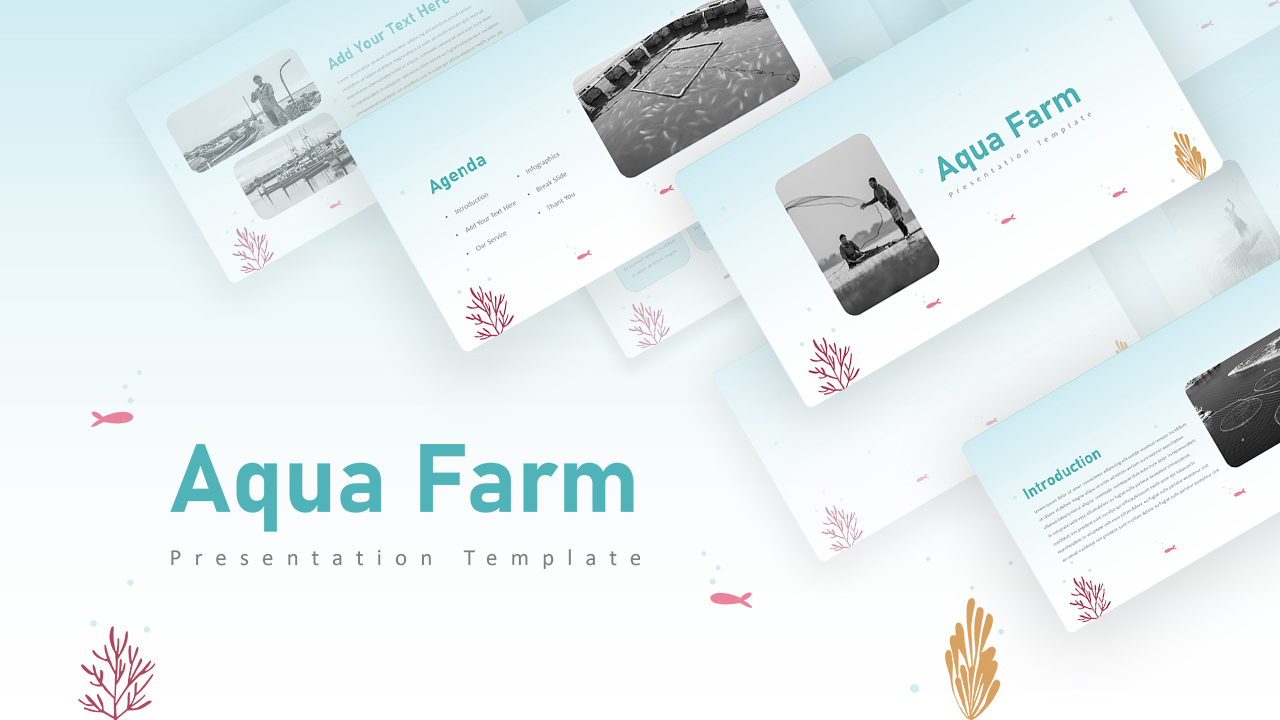
Aqua Farm Presentation Deck for PowerPoint & Google Slides
Decks
-
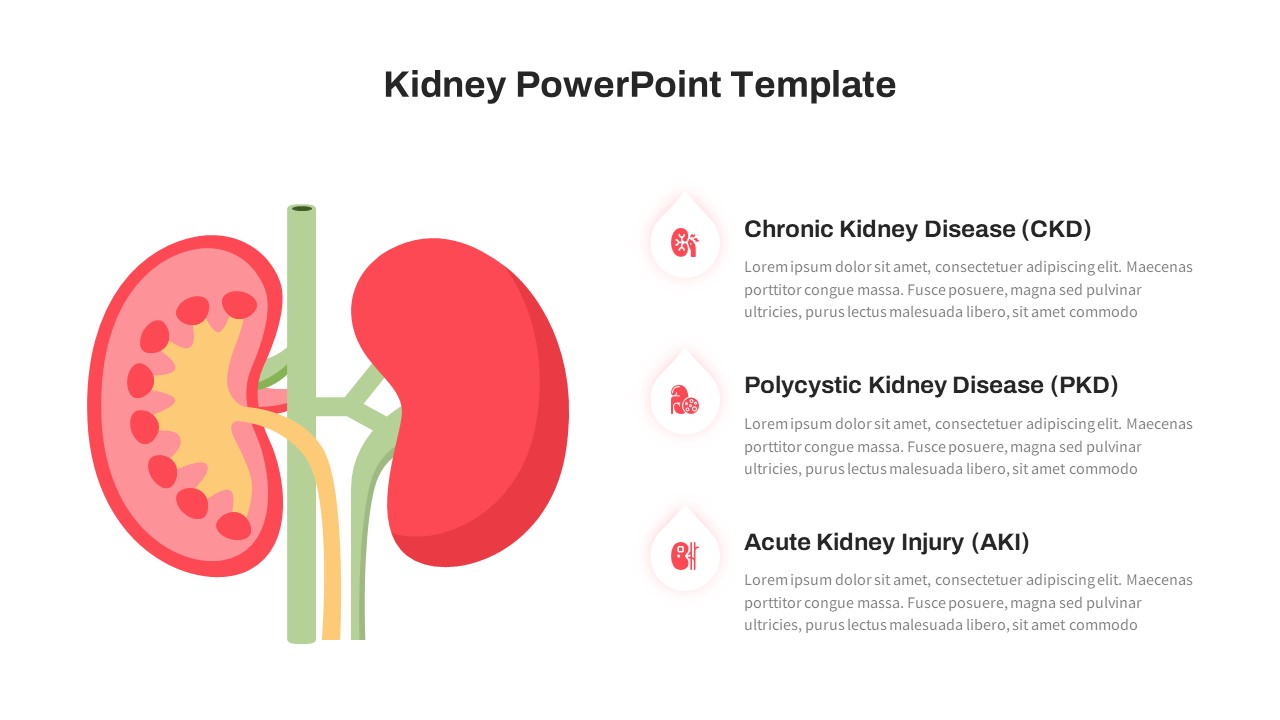
Kidney Disease Infographic Slide for PowerPoint & Google Slides
Health
-
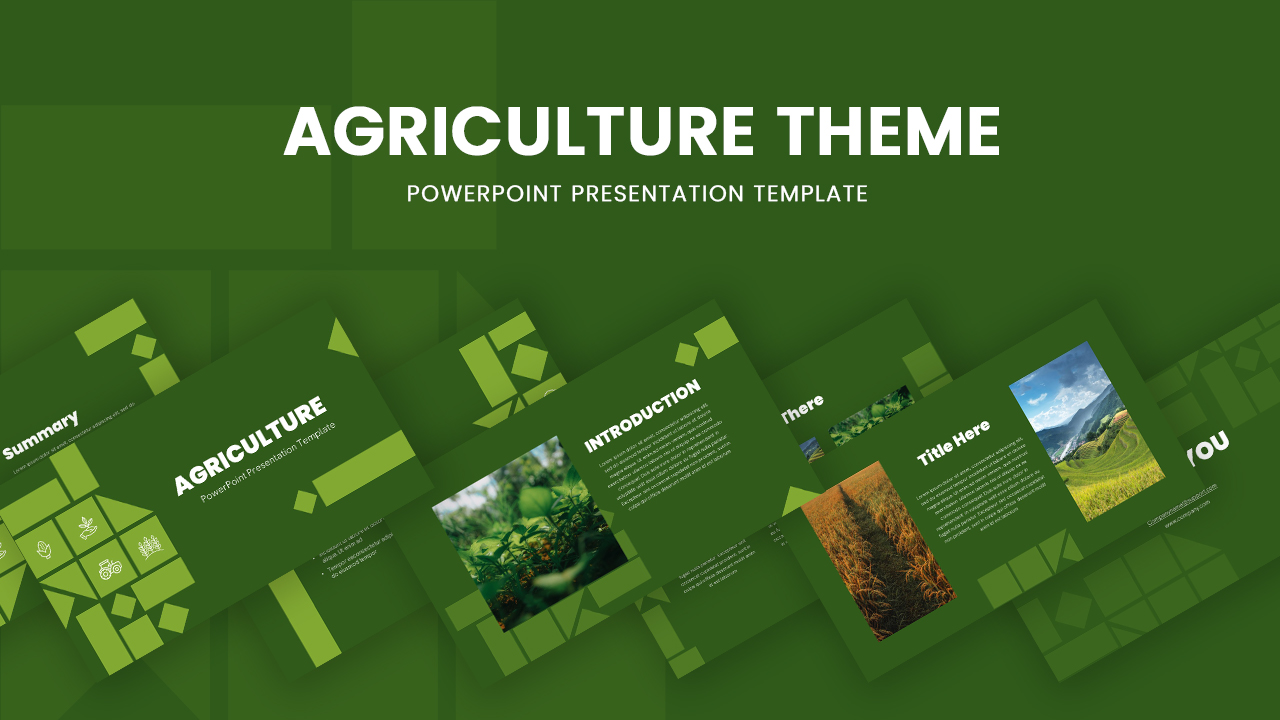
Sustainable Agriculture Theme Deck for PowerPoint & Google Slides
Business Proposal
-
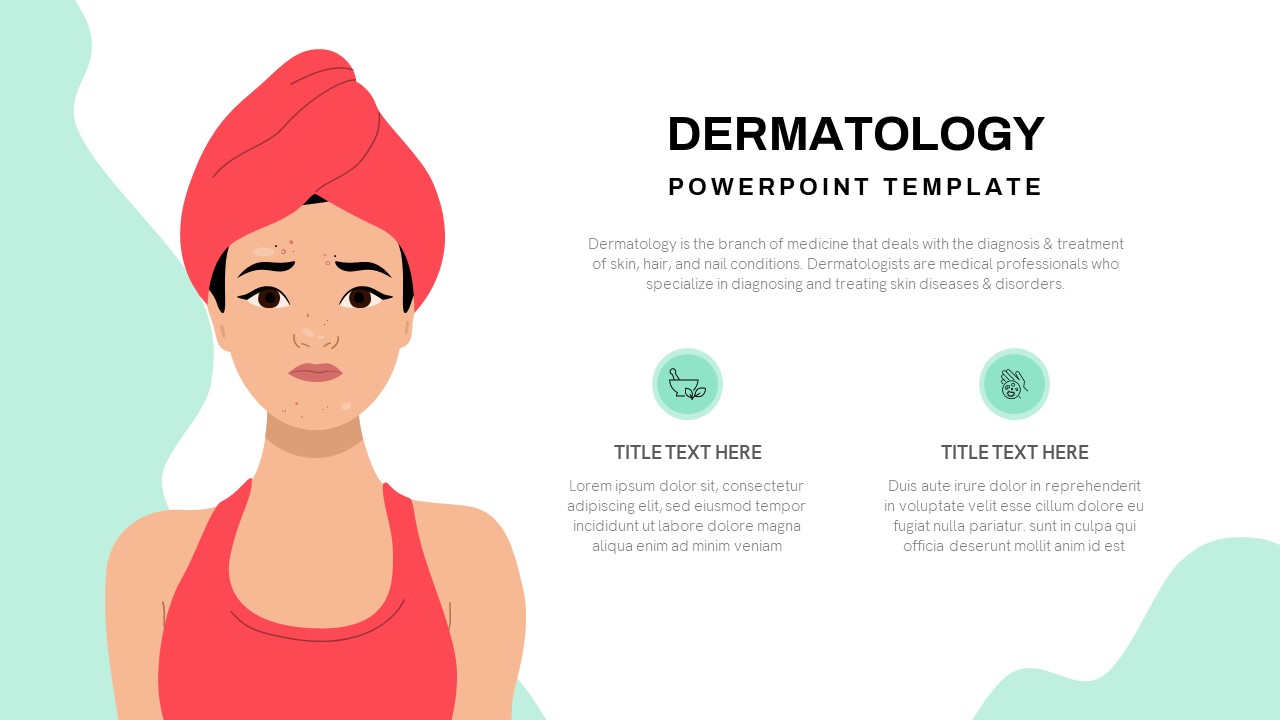
Dermatology Diagnosis and Treatment Slide for PowerPoint & Google Slides
Health
-
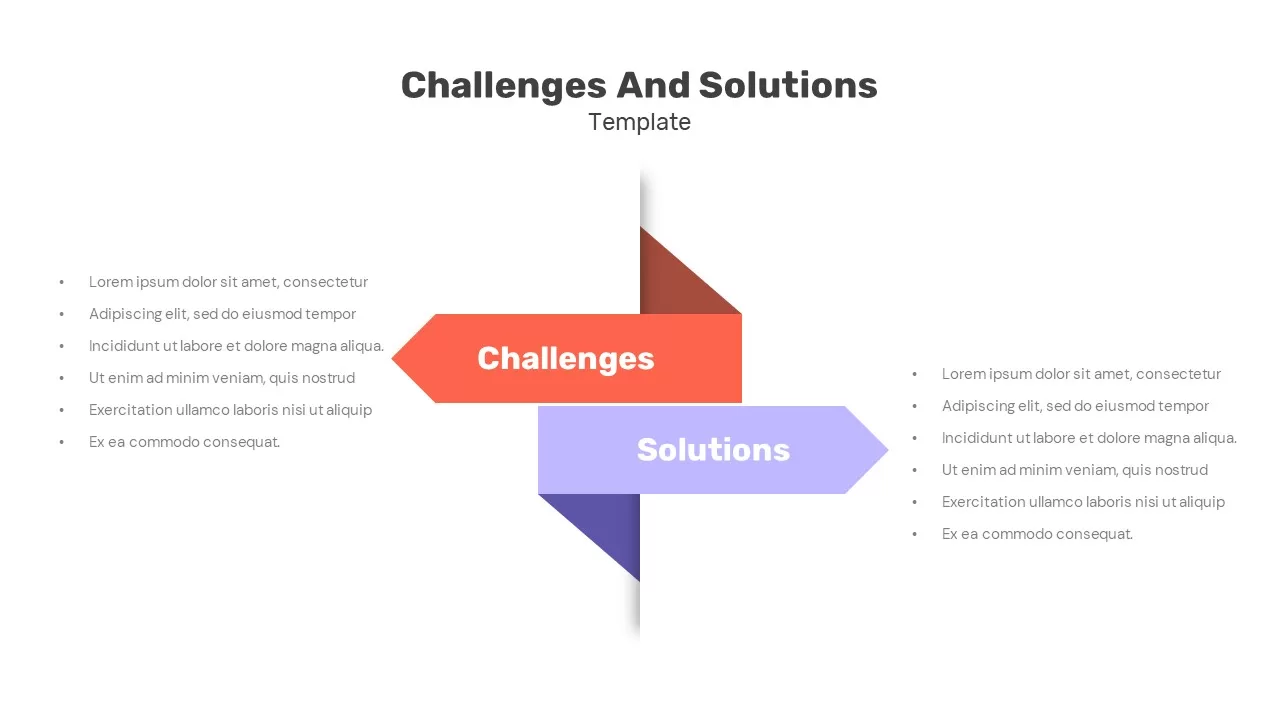
Challenges and Solutions Comparison Slide for PowerPoint & Google Slides
Opportunities Challenges
-
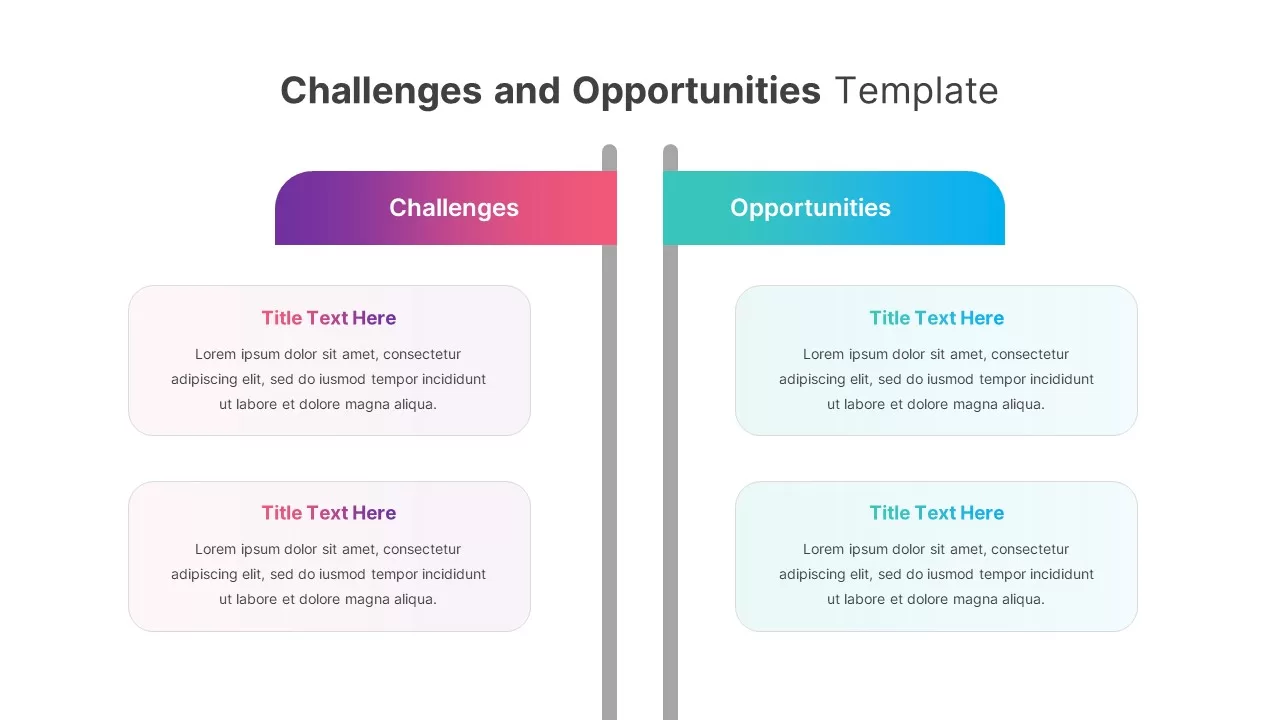
Gradient Challenges and Opportunities Slide for PowerPoint & Google Slides
Opportunities Challenges
-
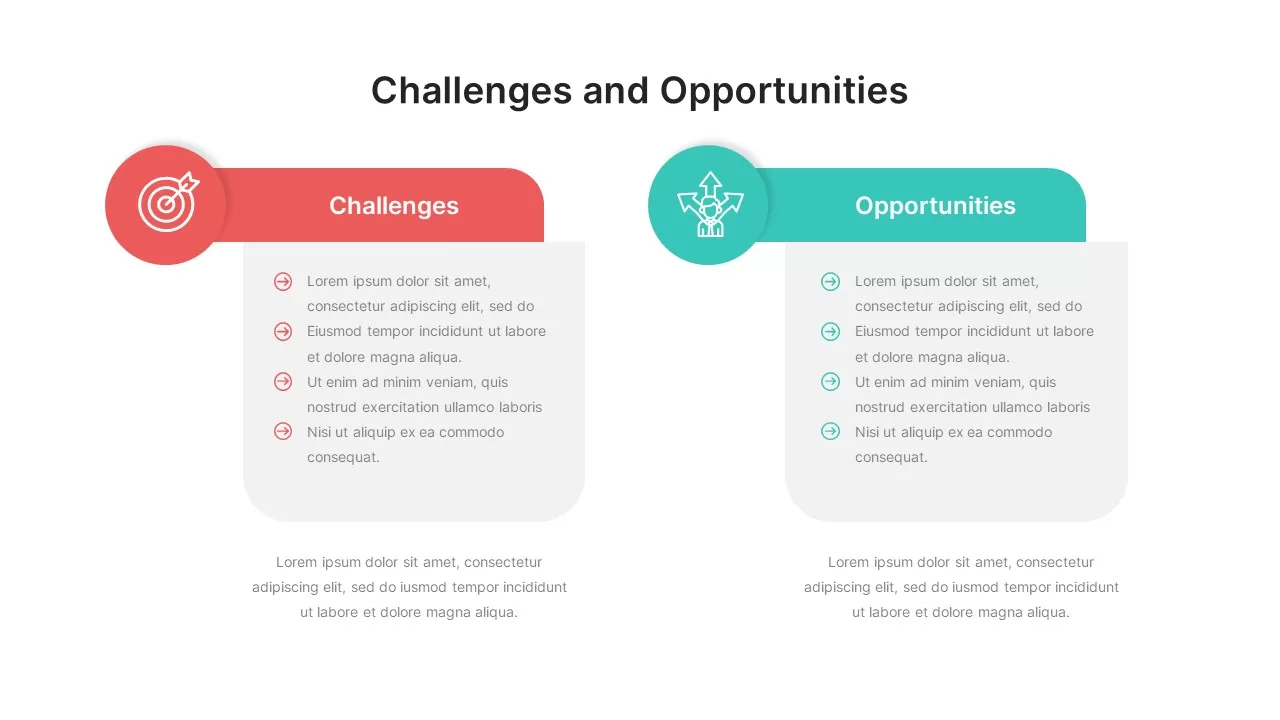
Challenges and Opportunities Comparison Slide for PowerPoint & Google Slides
Opportunities Challenges
-
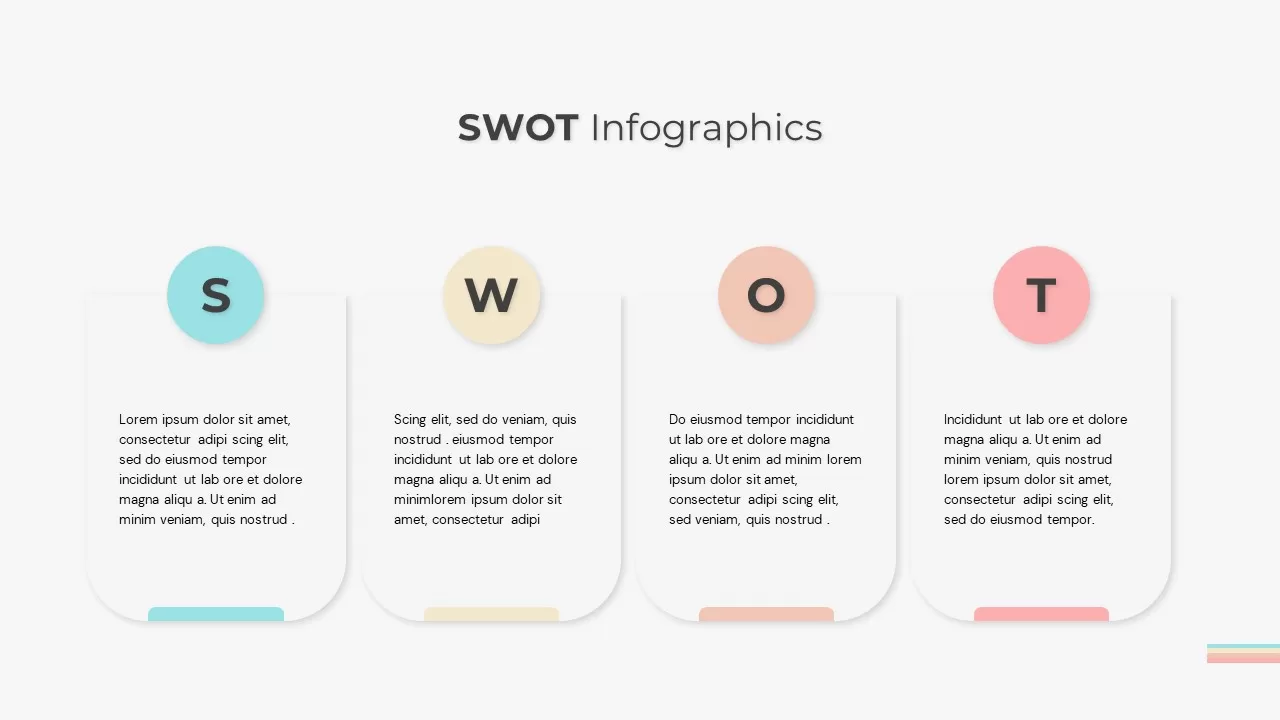
SWOT Analysis Infographic Slide for PowerPoint & Google Slides
SWOT
-
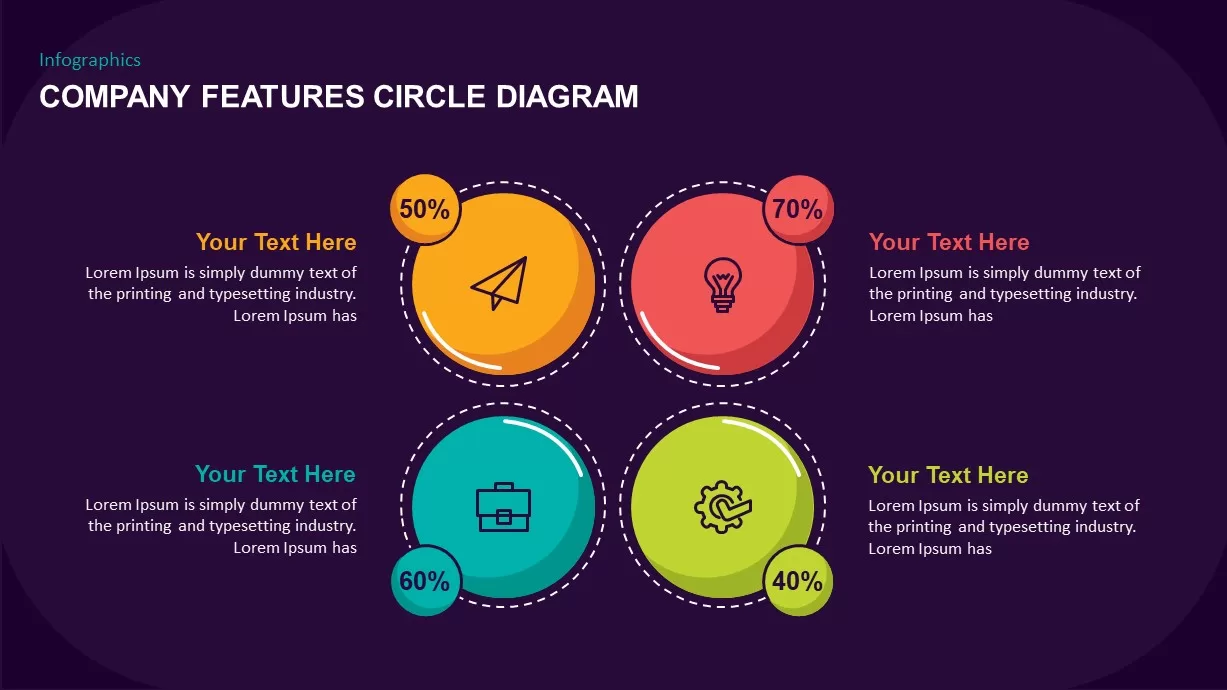
Company Features Circle Diagram for PowerPoint & Google Slides
Process
-
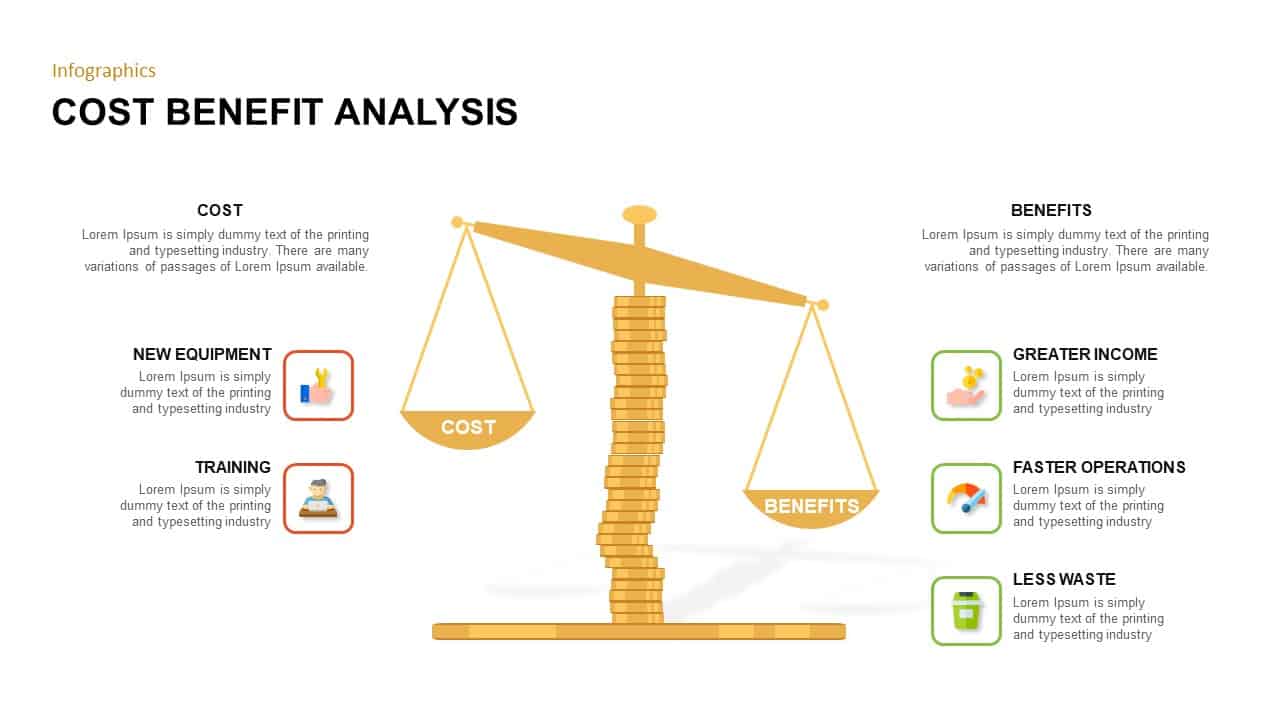
Cost Benefit Analysis infographic for PowerPoint & Google Slides
Comparison
-
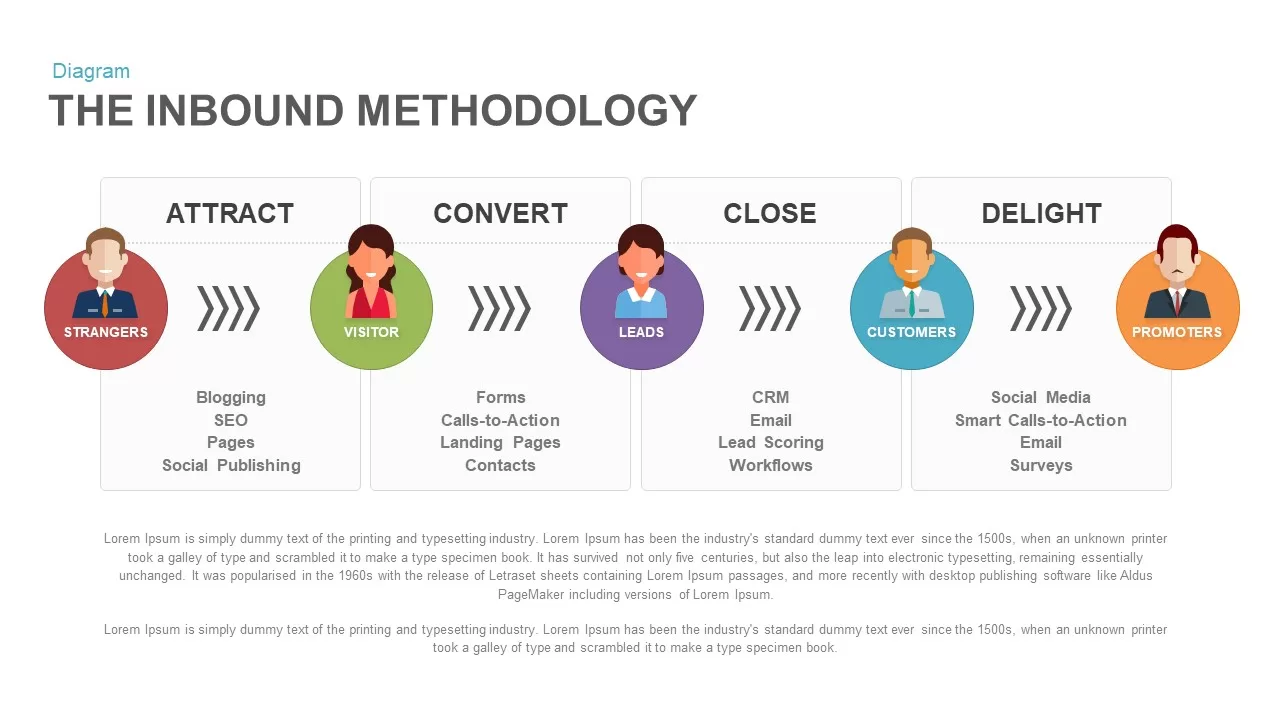
Inbound Methodology Process Diagram for PowerPoint & Google Slides
Process
-
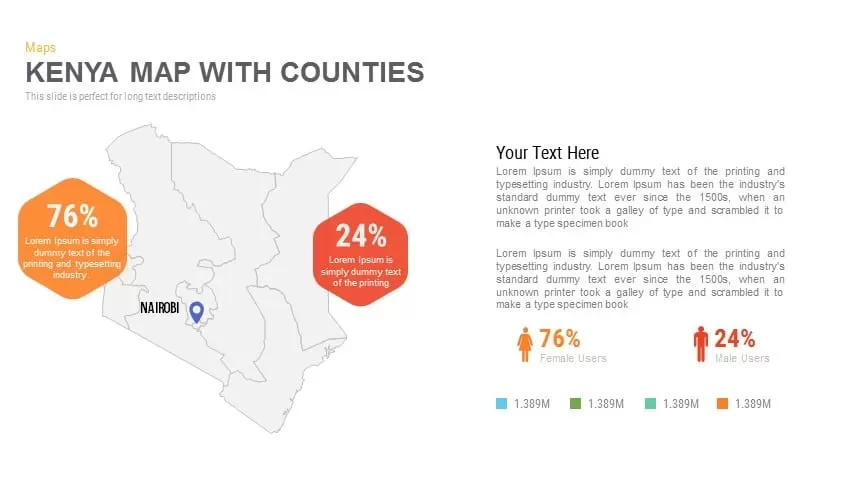
Kenya Map with Counties Overview for PowerPoint & Google Slides
World Maps
-
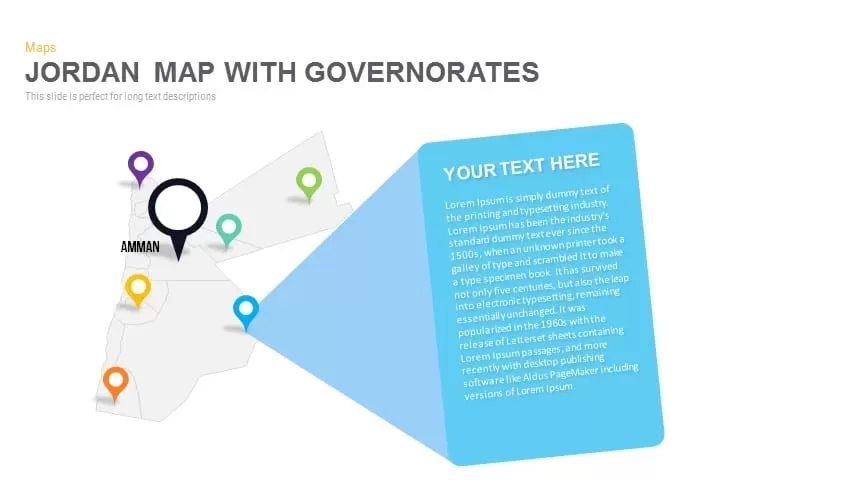
Jordan Map with Governorates Overview for PowerPoint & Google Slides
World Maps
-
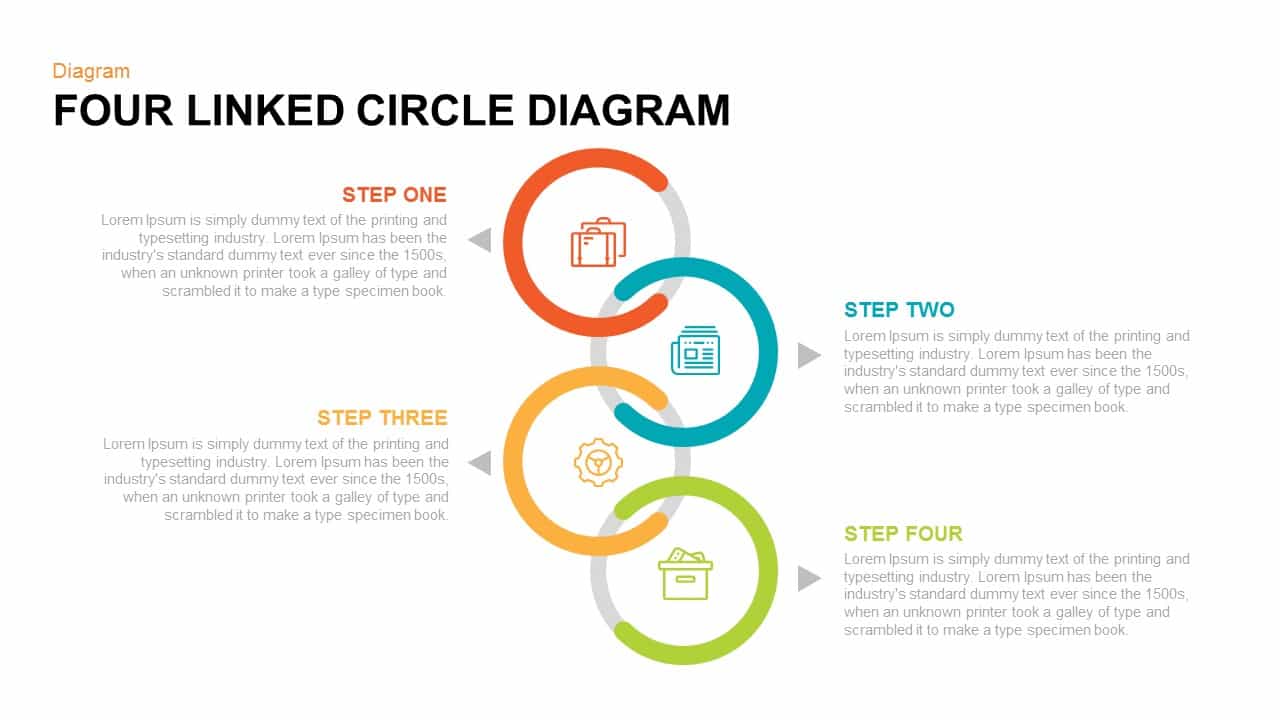
Four Linked Circle Diagram for PowerPoint & Google Slides
Process
-
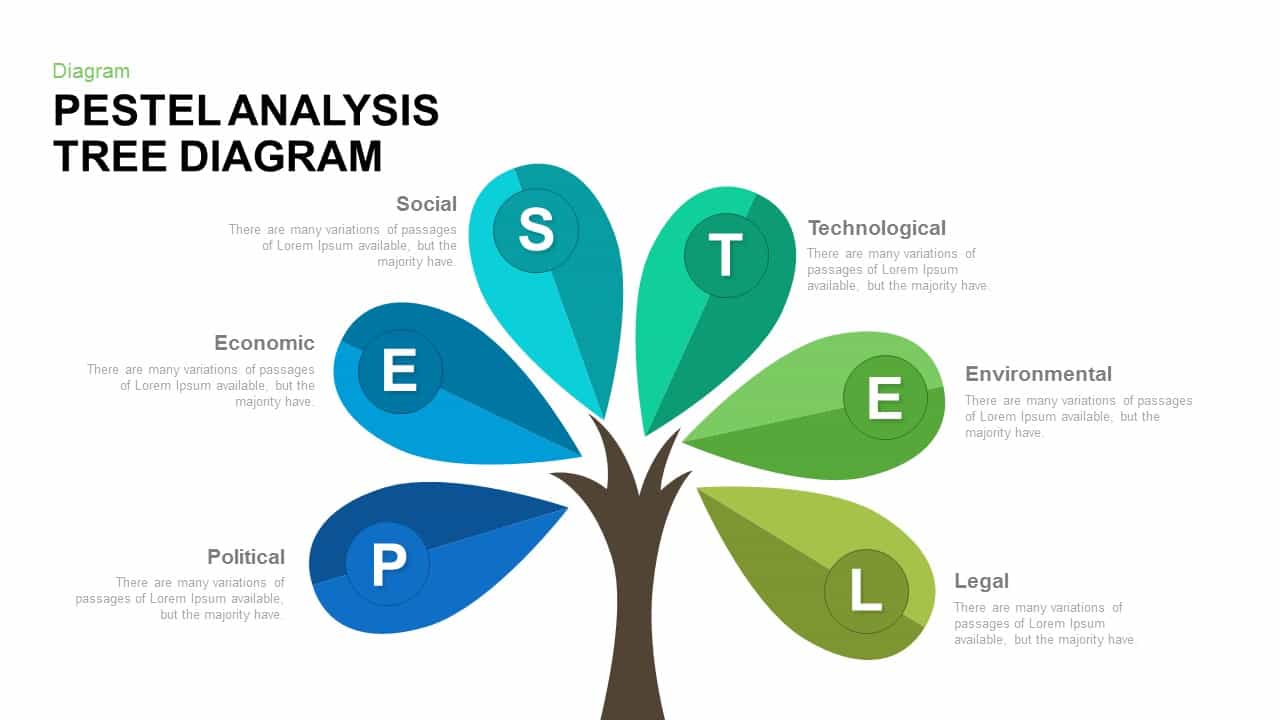
PESTEL Analysis Tree Diagram for PowerPoint & Google Slides
Process
-
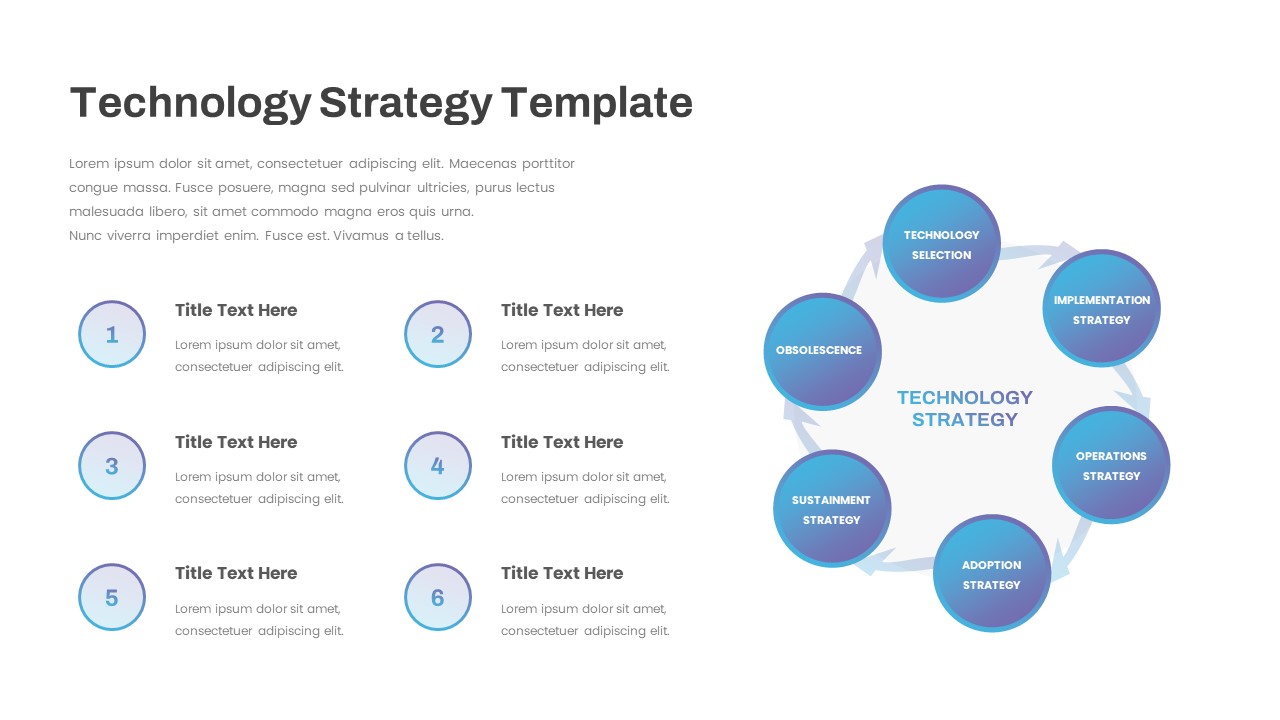
Technology Strategy Circular Diagram for PowerPoint & Google Slides
Information Technology
-
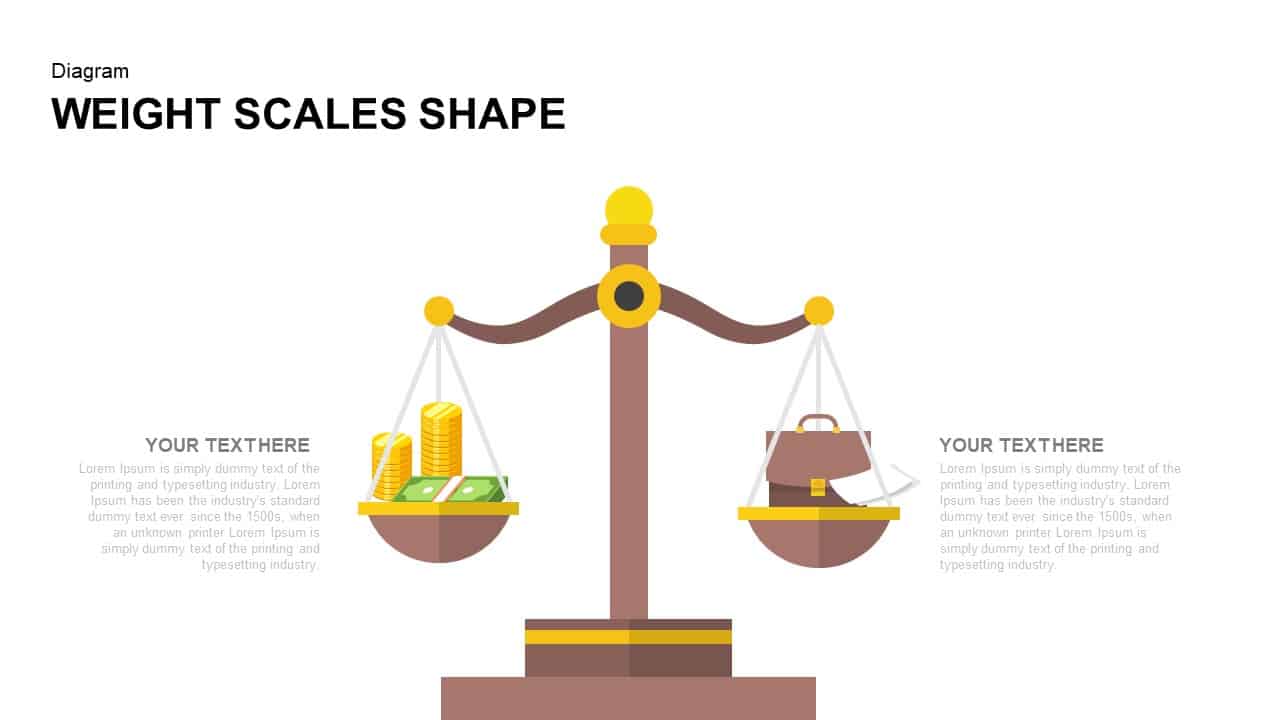
Weight Scales Shape Diagram for PowerPoint & Google Slides
Comparison
-
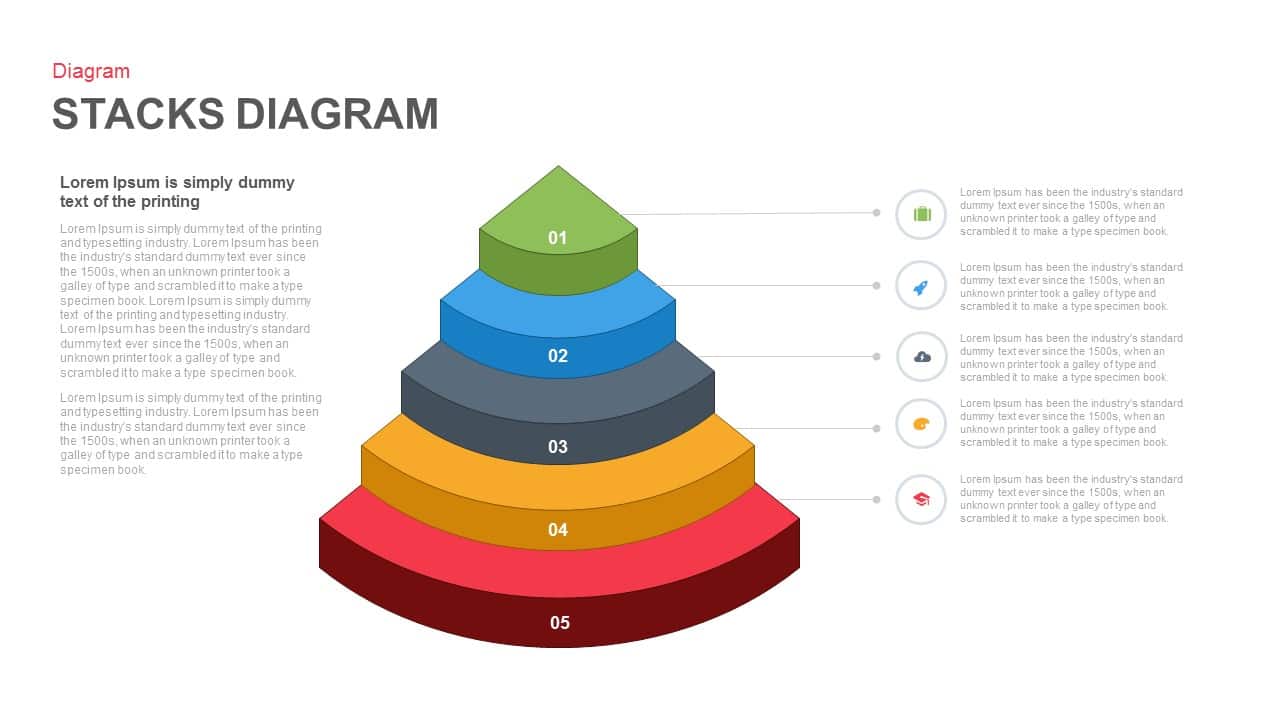
Five Staged Stacks Diagram for PowerPoint & Google Slides
Process
-

Business Growth and Partnership Background for PowerPoint & Google Slides
Business
-
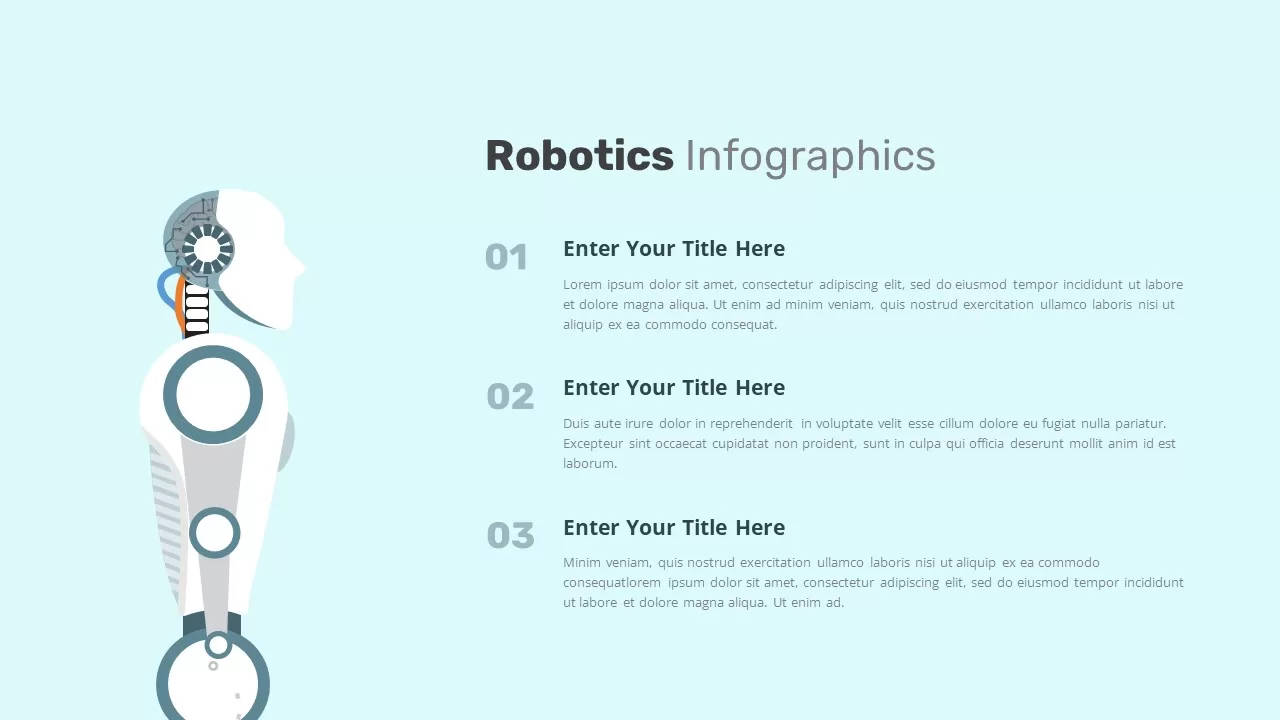
Robotics Process Overview Infographic for PowerPoint & Google Slides
AI
-
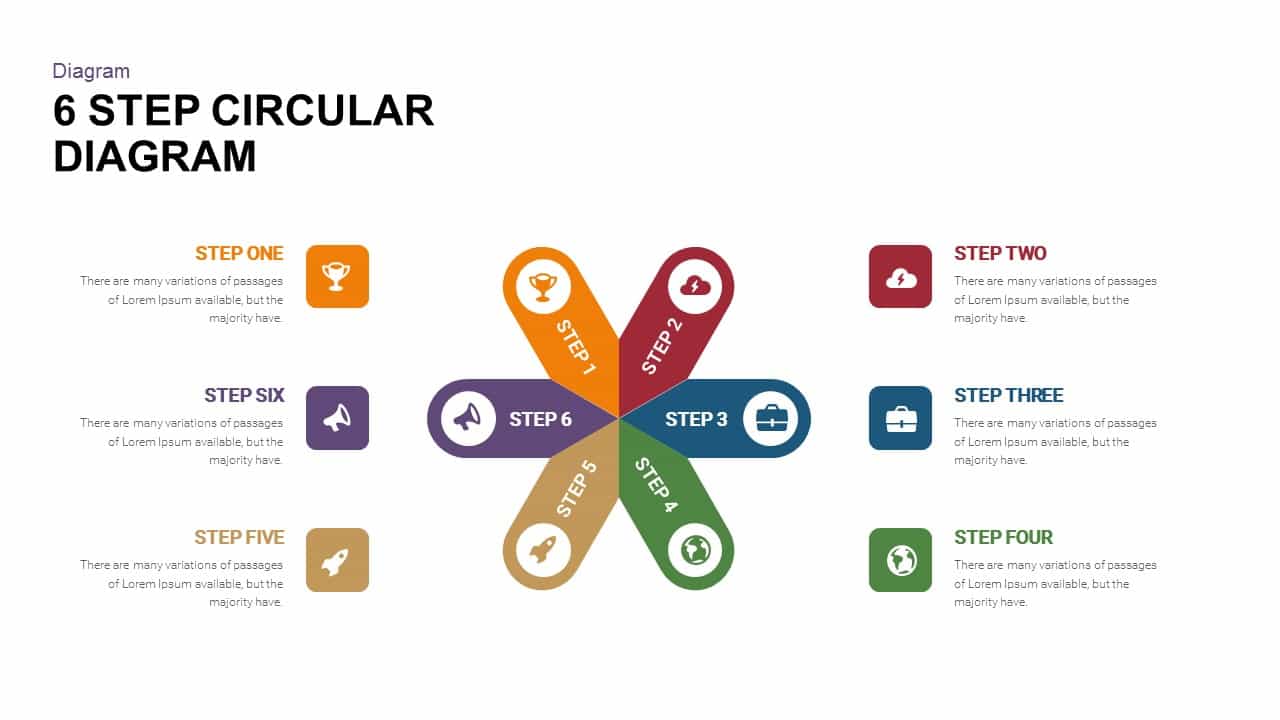
6 Step Circular Diagram for PowerPoint & Google Slides
Process
-
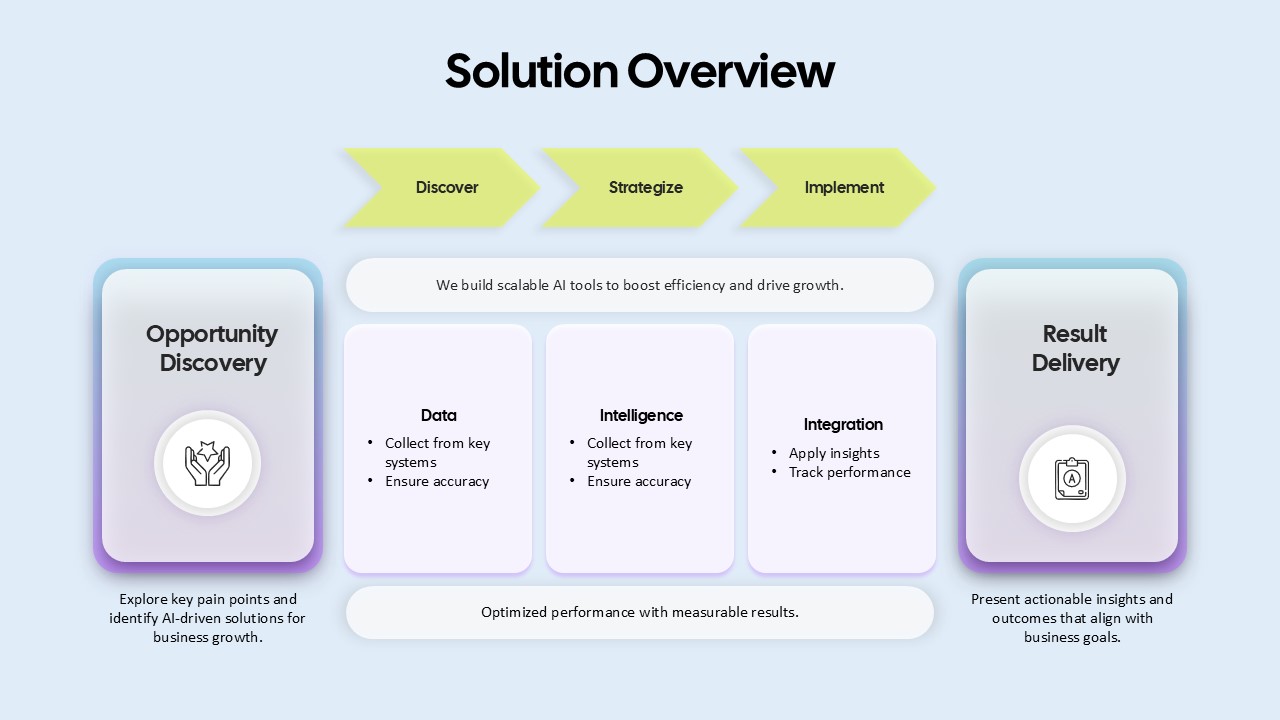
AI-Driven Solution Overview for PowerPoint & Google Slides
AI
-
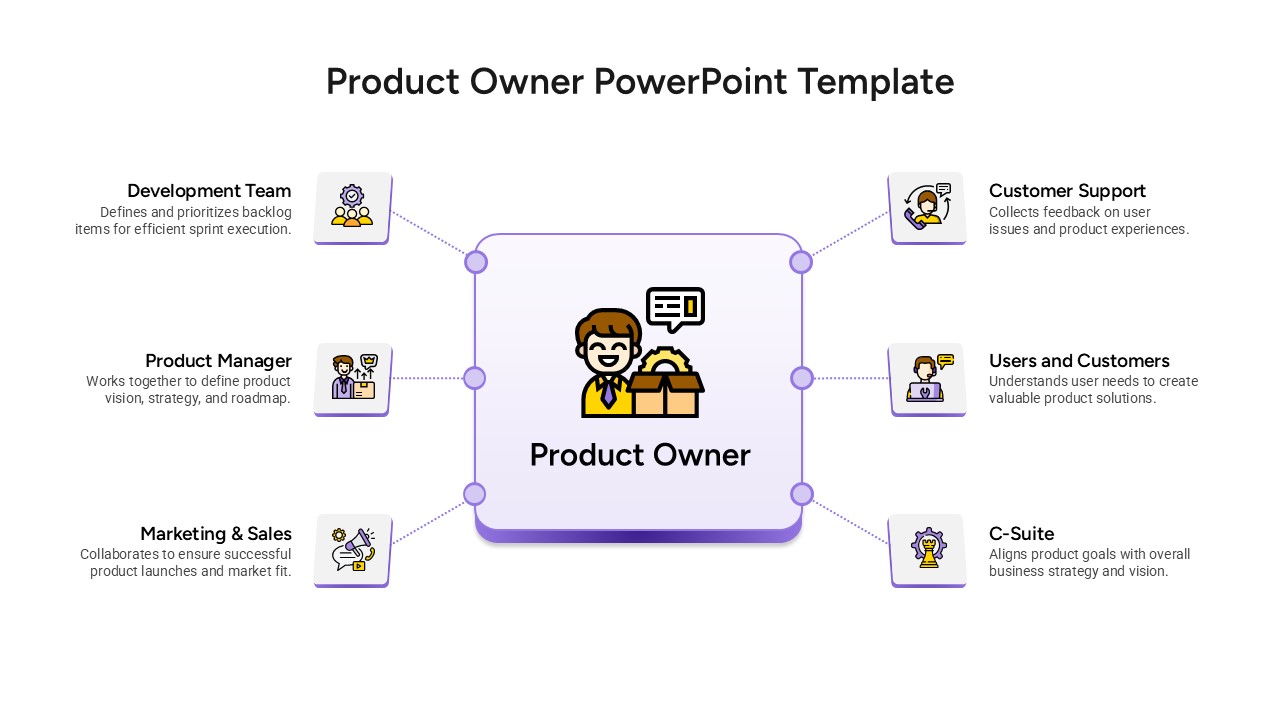
Product Owner Role and Responsibilities for PowerPoint & Google Slides
Business Plan
-
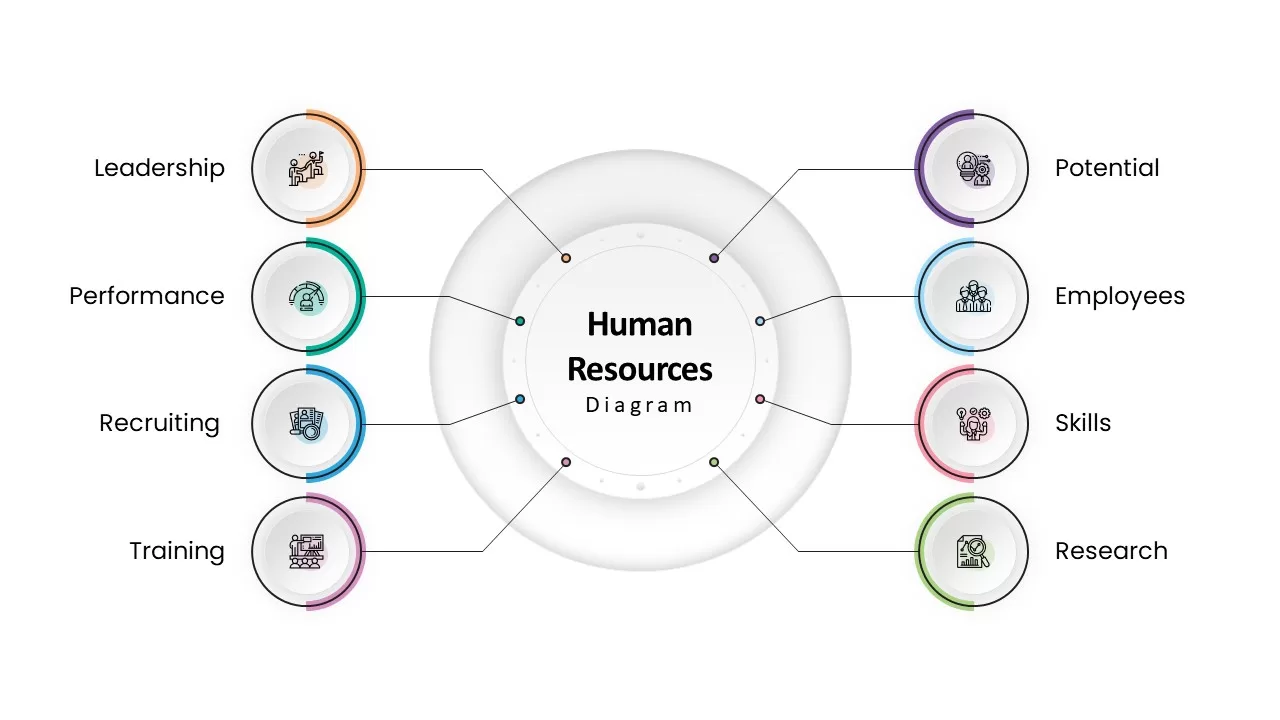
Human Resources Diagram Infographic for PowerPoint & Google Slides
Business