Curves and Lines PowerPoint Templates
Download these curves and lines PowerPoint templates to delight your audience with our attractive slides.
Filter
Filter
-

7-Year Career Journey PowerPoint Template
Timeline PowerPoint Template
-

Experience Curve PowerPoint Template
Keynote Templates
-

Cone Of Uncertainty PowerPoint Template
PowerPoint Charts
-

QC Tools PowerPoint Template
Infographic
-

Growth Curve Line Chart PowerPoint Template
Curves and Lines
-

Forecast Chart PowerPoint Template
PowerPoint Charts
-

Disruptive Innovation PowerPoint Template
PowerPoint Templates
-

S Curve Template For PowerPoint
PowerPoint Templates
-

Bell Curve PowerPoint Template
PowerPoint Templates
-
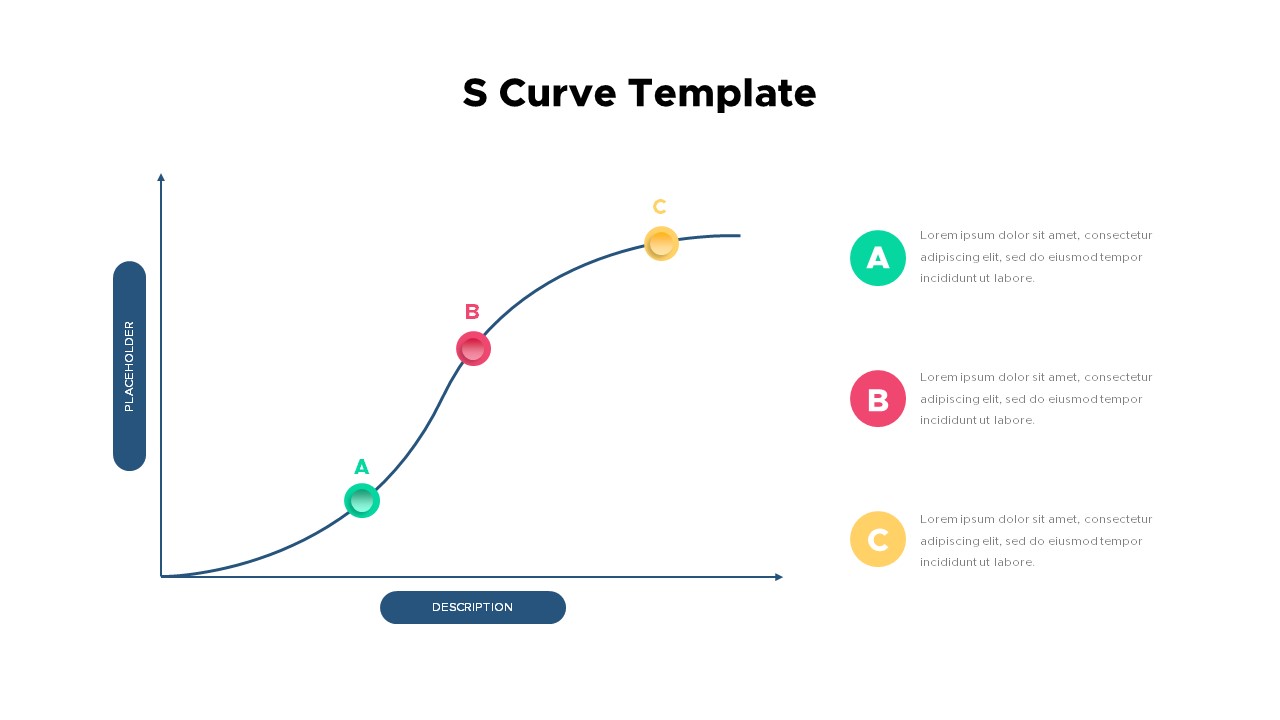
S Curve PowerPoint Template
Curves and Lines
-

4 Step Curved Arrow Infographic
Infographic
-

Curved Arrow Infographic PowerPoint Template
Infographic
-

Curved Arrow Template
Infographic
-

PPT Curved Arrow Template
Infographic
-

Curved Arrow PowerPoint Template
Infographic
-

Curved Arrow PPT Template
Infographic
-

PowerPoint Curved Arrow Template
Infographic
-

Curved Arrow Slide Template
Infographic
-

Curved Arrow Presentation Template
Infographic
-

Curved Arrows Template Slides
Infographic
-

Presentation Curved Arrow Template
Infographic
-

Curved Arrows Infographics
Infographic
-

Curved Arrow Infographic Template PPT
Infographic
-

Curved Arrows Template PowerPoint
Infographic
-

PowerPoint Curved Arrow Template Slide
Infographic
-

Curved Arrow Infographics
Infographic
-

Curved Arrow Template for PowerPoint
Infographic
-

Curved Arrows Template
Infographic
-

Free Curved Arrows Infographic
Infographic
Free
-

Free Curved Arrow PowerPoint Template
Infographic
Free
-

Curved Arrows Infographic
Infographic
-

Curved Arrow Template PowerPoint
Infographic
-

Break-Even Analysis Template
PowerPoint Charts
-

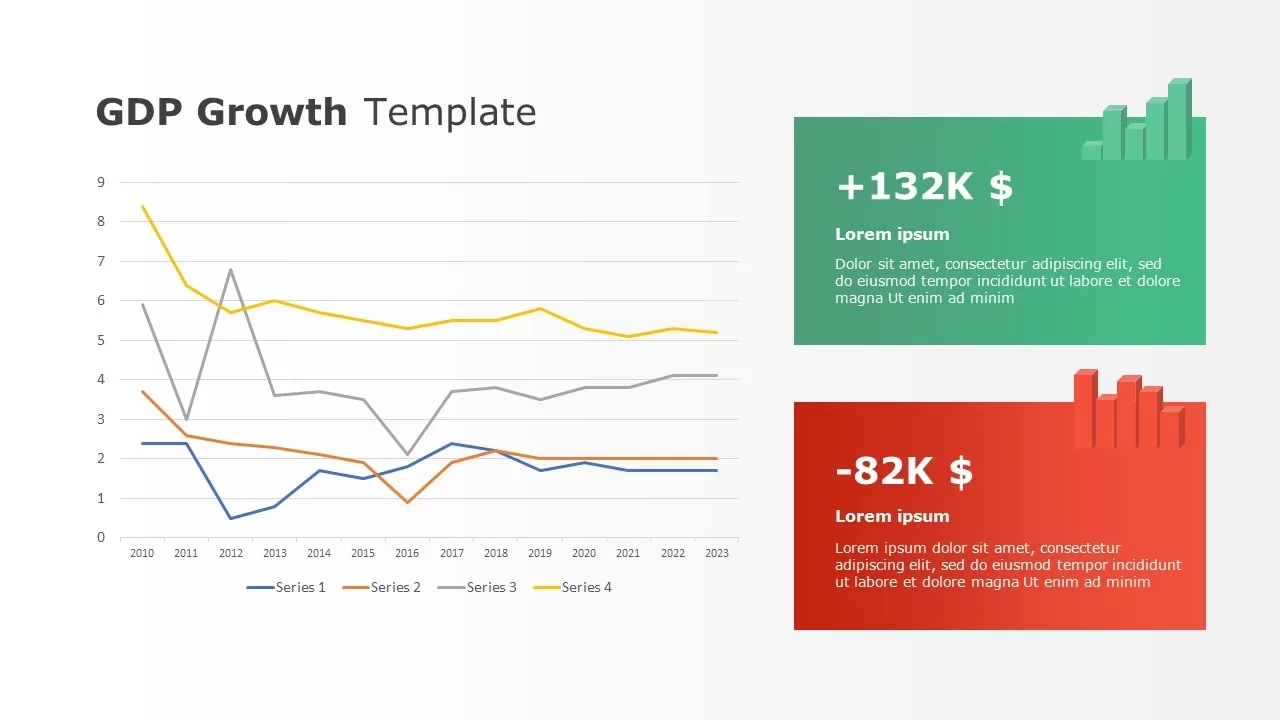
GDP Growth Template
Curves and Lines
-

Story Arc Template
Curves and Lines


