
- Usage of SmartArt in PowerPoint
- Use SmartArt graphics if you want to do any of the following:
- How to Create a SmartArt graphics and add text to it
- Add or delete shapes in your SmartArt graphics
- The different types of SmartArt:
- List – SmartArt
- Cycles – SmartArt
- Process – SmartArt
- Hierarchy – SmartArt
- Matrix – SmartArt
- Relationship – SmartArt
- Pyramid – SmartArt
- Picture – SmartArt
Usage of SmartArt in PowerPoint

Usage of SmartArt in PowerPoint
You can use the SmartArt option in PowerPoint to easily incorporate charts and many other types of diagrams into presentations. A SmartArt graphic is a visual representation of ideas and information, and a chart is a visual illustration of numeric data or value. With SmartArt PowerPoint, you don’t have to individually create all the shapes and connectors between boxes in a diagram. While charts are designed for numbers, SmartArt graphics are designed for text.
Use SmartArt graphics if you want to do any of the following:
- Create an organization chart.
- Illustrate steps or stages in a process or workflow.
- Show hierarchy, such as a decision tree.
- Show the flow of a process, procedure, or another event.
- Show cyclical or repetitive information.
- List information.
- Create a matrix illustration.
- Show hierarchical or proportional information in a pyramid illustration.
- Show a relationship between parts, such as overlapping concepts.
- Create an illustration quickly by typing or pasting your text and having it automatically positioned and arranged for you.
How to Create a SmartArt graphics and add text to it
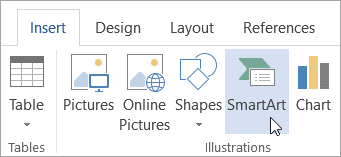
- From the Insert tab on the top, go to the Illustrations group and click SmartArt.
- A Choose a SmartArt Graphic dialog box will appear. In that choose the type of SmartArt and the layout of your choice.
- Enter text by doing any one of the following:
- Copy text from a different location or program, click [Text] from the Text pane, and then paste your text in there.
- Click [Text] from the Text pane, and type your text in there.
Tips:
- If the Text pane is not available or visible, click the arrow control situated on the left of the SmartArt graphic.
- To add text in a random position on top of or close to your SmartArt graphics, on the Insert tab, from the Text group, click Text Box to insert. If you want to see only the text in your box to appear and not the box, right-click on the text box, and select Format Text Box or Format Shape, and then change the settings of the text box to have no border and background color.
- Click on a box in SmartArt graphic, and type your text. For the best results, use this option after you have added all of the boxes that you need.
Add or delete shapes in your SmartArt graphics
- Select the SmartArt graphic on which you want to add another shape.
- Click the existing shape that is nearer to where you wish to add the new shape.
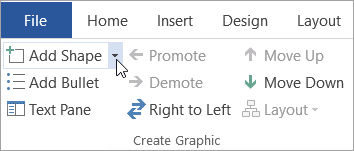
- Go to SmartArt Tools under which there is a Design tab, in the Create Graphic group. Click the downward arrow to the right of Add Shape option.
If the SmartArt PowerPoint Tools or Design tab is not visible, make sure that you have selected the SmartArt graphic once again. You will have to double-click the SmartArt graphics tab to open the Design tab.
Try doing any one of the below:
- Click Add Shape After, to insert a shape after the selected shape.
- Click Add Shape Before to insert a shape before the selected shape.
Tips:
- Click an existing shape, move your cursor after or before the text where you want to add the shape, and then click ENTER – If you want to add a shape from the Text pane
- Click the shape you wish to delete, and then press DELETE. To delete your entire SmartArt graphic, click the border of your SmartArt graphic, and press DELETE – To delete a shape from your SmartArt PowerPoint graphics.
The different types of SmartArt:
Depending on the type of data that you are presenting, some types of charts are convenient than others. But no worries, there are no rules on how to use SmartArt, just suggestions only.
List – SmartArt
The SmartArt list style is the best you can use when you have a bulleted list of data to make it more visually appealing in in PowerPoint.
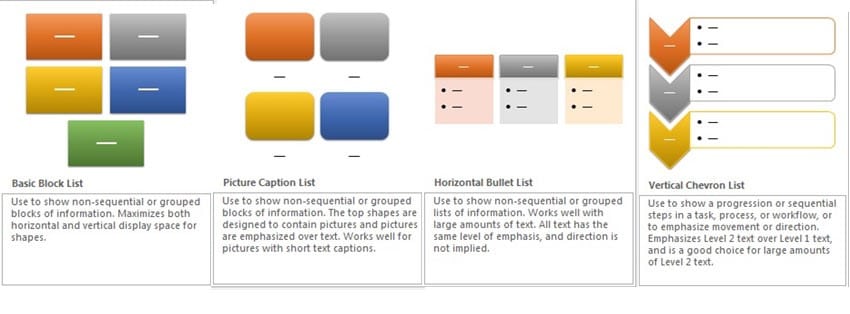
Lists are pretty adaptable. There is a variety of SmartArt PowerPoint styles, ranging from simple “Basic Blocks” to “Vertical Lists” that show things in a sequenced, descending order. Start with a list style and iterate from there, if you are not sure which style to use.
Cycles – SmartArt
The Cycles smart arts are somewhat same as process maps, but they are continuous in nature. Use a Cycle type chart when you want to map a process that will keep on going.
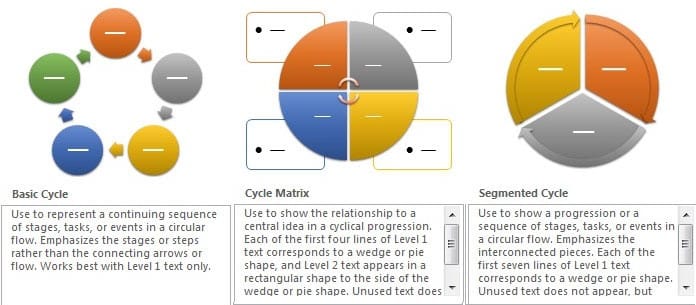
Cycles are continuous and ongoing processes. If you are running a company where the processes flow each month similarly, it is more convenient to use cycles to capture those processes
Process – SmartArt
Process flows are one of the best and easy ways to use SmartArt. If you are working with teams or groups to document how a process must work, SmartArt is a great visual map to capture the processes.
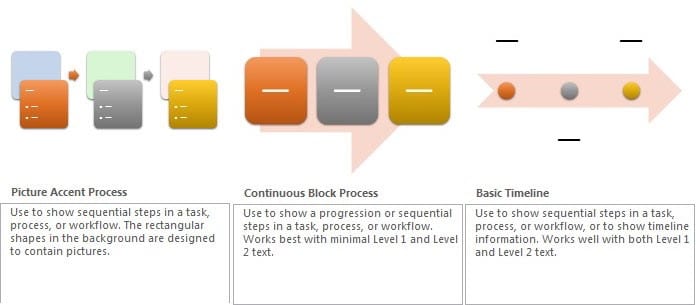
The Process SmartArt PowerPoint styles can help you to record how things must happen, (process by process) step by step. If you are making a product, you can use a Process SmartArt to show how each and every manufacturing process is carried out in steps.
Hierarchy – SmartArt
Hierarchies are designed to show how things descend in an organization or process. One natural use for this type of chart is building an organizational chart for a company or group of individuals.
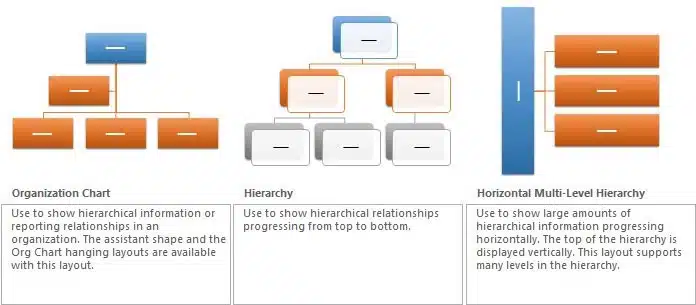
Another use of hierarchy is to show the different individual parts of a larger whole. For example, using a hierarchy to show the raw materials inside a finished product.
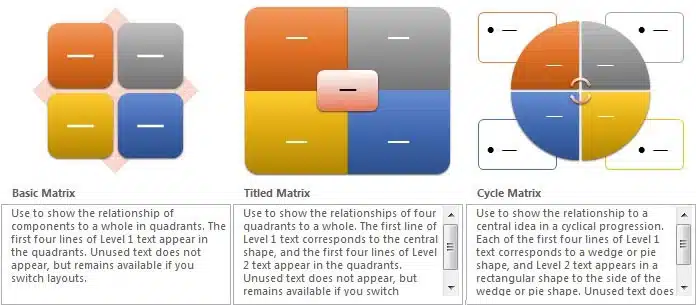
Matrix – SmartArt
Matrix is somewhat like a relationship chart, but it is more about taking a single object and splitting it or dividing into equal parts that make up the whole object.
Relationship – SmartArt
A relationship is generally used to show how individual parts relate. In the examples below, you can see that there are a variety of relationship charts: balance, funnels, and hexagon cluster.
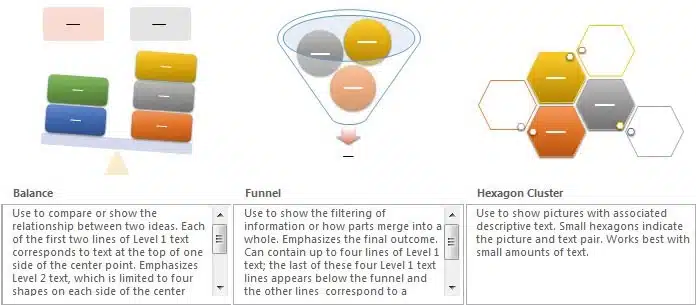
The common thing between all of these is that all these charts show how each part relate to one another.
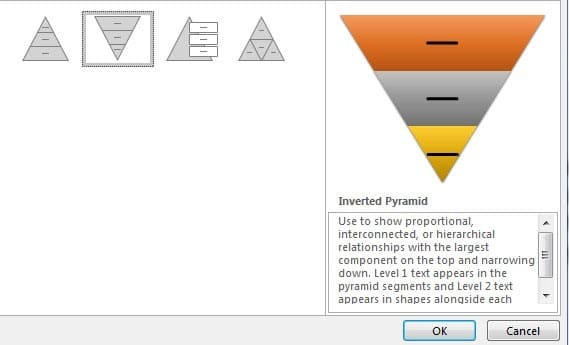
Pyramid – SmartArt
Pyramids can be defined as hybrids between hierarchies and process charts. Each pyramid is unique and shows how each part of the pyramid fit in together.
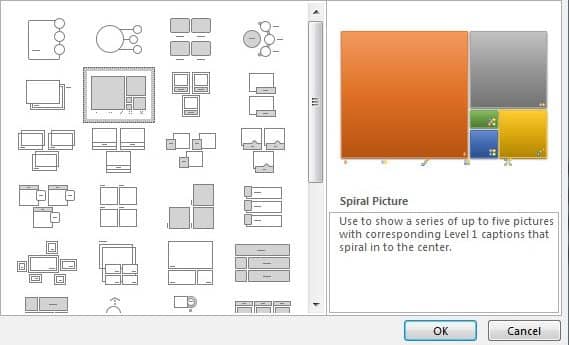
Picture – SmartArt
The Picture category in SmartArt PowerPoint is a bit like an odd one. It contains styles from different categories but makes it easy to add an image (or images) from your PC.
Never settle for the default template for diagrams. The power of SmartArt depends on the way you make use it. Explore all the options till you have a satisfying result. Also, check out our collection of Pyramid templates, pyramid PPT template and Free Balanced Diet Food Pyramid Template.
Related Articles
-
 July 7th, 2024
How to Create a Poster Presentation
Blog Post -
 April 25th, 2024
A Guide To Create Fishbone Diagram Template In PowerPoint
Blog Post -
 February 15th, 2021
Uses of organizational chart for presenting company work structure
Blog Post