
- Why Measuring Internal Client Satisfaction Matters for Presentation Teams
- The 5-Question Internal Client Satisfaction Survey
- Optimal Timing and Distribution Methods
- Setting Response Rate Goals
- Analyzing and Acting on Survey Results
- Practical Implementation Tips
- Success Metrics Beyond Satisfaction
- Conclusion
Measure Internal Client Satisfaction With Your Presentation Team (5-Question Survey)


About the author: Anand RK is a presentation expert and founder of SlideBazaar, helping professionals create polished presentations through modern templates, useful content, and AI presentation tools.
As someone who’s led presentation teams for over a decade, I’ve learned that our internal clients often have different expectations than external ones. Yet many organizations overlook the value of formally measuring satisfaction among these internal stakeholders. Your presentation team might be creating visually stunning decks, but are they truly meeting the needs of your sales, executive, and marketing teams who rely on them?
Internal client satisfaction is the hidden metric that can transform your presentation team from a production resource into a strategic partner. By implementing a simple 5-question survey after each project, you’ll gather actionable insights that drive improvement and strengthen those critical internal relationships.
Why Measuring Internal Client Satisfaction Matters for Presentation Teams
Presentation teams occupy a unique position in any organization. They transform complex information into compelling visual narratives that drive decisions, secure funding, and win business. Yet their success depends entirely on how well they serve their internal clients—the colleagues who request and use these presentations.
Unlike external client satisfaction (which typically focuses on end products and services), internal satisfaction measurement helps you understand how effectively your teams collaborate across departmental boundaries. For presentation teams specifically, this feedback loop is vital because:
1. It highlights communication gaps between what requesters need and what the presentation team delivers
2. It identifies process bottlenecks that cause frustration or delay projects
3. It reveals training opportunities for both the presentation team and those requesting presentations
4. It builds trust and credibility by demonstrating commitment to continuous improvement
According to SurveyMonkey, organizations that regularly collect internal feedback see 25% higher employee engagement and 20% better cross-functional collaboration (source). For presentation teams specifically, this translates to more strategic input, smoother production processes, and greater impact with final deliverables.
The 5-Question Internal Client Satisfaction Survey
The key to high response rates is brevity and relevance. LimeSurvey, a leader in survey methodology, recommends keeping internal satisfaction surveys under 2 minutes to complete, with clear, actionable questions (source).
Here’s a focused 5-question survey specifically designed for presentation teams:
Survey: Presentation Team Feedback
Question 1: Ease of Collaboration
How would you rate the ease of collaborating with our presentation team on this project?
– Very difficult (1)
– Somewhat difficult (2)
– Neutral (3)
– Somewhat easy (4)
– Very easy (5)
Question 2: Quality of Delivery
How satisfied are you with the quality of the final presentation delivered?
– Very dissatisfied (1)
– Somewhat dissatisfied (2)
– Neutral (3)
– Somewhat satisfied (4)
– Very satisfied (5)
Question 3: Timeliness
How would you rate the timeliness of the presentation team in meeting your deadlines?
– Missed deadline significantly (1)
– Missed deadline slightly (2)
– Met deadline exactly (3)
– Delivered ahead of schedule (4)
– Delivered well ahead of schedule (5)
Question 4: Overall Satisfaction
Overall, how satisfied are you with the presentation service provided?
– Very dissatisfied (1)
– Somewhat dissatisfied (2)
– Neutral (3)
– Somewhat satisfied (4)
– Very satisfied (5)
Question 5: Open Feedback
What one thing could we do to improve our presentation service for your next project?
[Open text field]
According to Qualtrics research on question design, this balanced approach of both scaled questions (1-4) and an open-ended question (5) provides both quantitative metrics to track over time and qualitative insights for improvement (source).
Optimal Timing and Distribution Methods
Timing is everything when it comes to survey response rates. Based on best practices from SurveyMonkey, here’s the optimal approach for presentation team feedback:
1. Send immediately after delivery – Send the survey within 24 hours of delivering the final presentation while the experience is still fresh
2. Set a clear response window – Request completion within 2-3 days
3. Send one reminder – If no response after 2 days, send a single gentle reminder
4. Keep it accessible – Use mobile-friendly survey tools that work across devices
SurveyMonkey data shows that surveys sent within 24 hours of project completion receive up to 40% higher response rates than those sent a week later (source).
For distribution, consider integrating the survey directly into your presentation handoff process. This could mean:
– Adding a survey link in the final email when delivering the presentation
– Including a QR code on the last slide of the deck itself
– Automating a survey trigger through your project management system
Setting Response Rate Goals
Low response rates can skew your data and limit its usefulness. Sogolytics recommends targeting a minimum 30% response rate for internal service surveys, with 50%+ considered excellent (source).
To achieve these targets:
1. Make the purpose clear – Explain how feedback will be used to improve service
2. Respect time constraints – Keep the survey under 2 minutes to complete
3. Show appreciation – Thank respondents and acknowledge their input
4. Close the loop – Share how previous feedback has led to improvements
The most effective presentation teams I’ve led maintained response rates above 60% by making the survey part of their standard delivery process and demonstrating responsive changes based on feedback received.
Analyzing and Acting on Survey Results
Collecting data is only valuable if you use it to drive improvement. SentiSum’s analysis of survey best practices suggests a three-step approach to making feedback actionable (source):
1. Track Quantitative Trends
Monitor the numerical scores from questions 1-4 to identify:
– Overall satisfaction trajectory – Is it improving, declining, or stable?
– Gap analysis – Which aspect (collaboration, quality, timeliness) shows the biggest opportunity?
– Department variations – Do certain internal clients consistently rate services differently?
Create a simple dashboard showing these metrics over time, with the ability to filter by department, project type, and team member.
2. Mine Qualitative Insights
The open-ended responses from question 5 often provide the most actionable insights. According to SentiSum, effective analysis involves:
– Categorizing comments by theme (process, design, communication, etc.)
– Identifying recurring pain points or suggestions
– Noting positive feedback that highlights team strengths
– Looking for correlations between low numerical scores and specific comments
Some teams use AI-powered text analysis tools to identify sentiment patterns in open-ended responses, particularly as survey volume grows.
3. Close the Feedback Loop
The most critical step is acting on the feedback and communicating those actions back to internal clients:
– Share summary findings with all stakeholders quarterly
– Develop specific improvement initiatives based on feedback themes
– Communicate what changes you’ve made in response to previous feedback
– Recognize team members who receive outstanding feedback
Sogolytics reports that presentation teams that implement this “closed-loop” approach see client satisfaction scores improve by an average of 22% over 12 months (source).
Practical Implementation Tips
Based on my experience and the research cited, here are practical tips for implementing your presentation team satisfaction survey:
Question Formulation
– Use consistent scales – Keep all rating questions on the same 5-point scale
– Balance positive and negative options – Provide equal opportunity for both praise and criticism
– Focus on the respondent’s experience – Frame questions from their perspective, not yours
– Avoid leading language – “How would you rate” is better than “How satisfied were you”
Qualtrics research shows that balanced question formulation increases response validity by 15% (source).
Automation and Integration
– Integrate the survey into your project management or presentation request system
– Set up automated distribution based on project completion
– Create real-time dashboards that update as responses come in
– Consider implementing survey logic that asks follow-up questions only when relevant
LimeSurvey notes that automated surveys integrated into existing workflows see 30% higher completion rates than standalone surveys (source).
Continuous Improvement Process
Turn survey results into a structured improvement process:
1. Monthly review – Analyze all feedback from the previous month
2. Quarterly planning – Develop improvement initiatives based on trends
3. Bi-annual training – Address skill gaps identified through feedback
4. Annual benchmarking – Compare year-over-year satisfaction metrics
Success Metrics Beyond Satisfaction
While satisfaction scores provide valuable feedback, the true measure of success is how your presentation team’s improved performance impacts business outcomes:
– Reduction in revision cycles – Fewer rounds of changes indicate better initial alignment
– Decreased turnaround time – More efficient processes from request to delivery
– Increased presentation usage – More colleagues requesting presentation support
– Business impact metrics – Win rates for presentations, executive adoption, etc.
SentiSum recommends tying satisfaction metrics to these operational and business outcomes to demonstrate the full value of your improvement efforts (source).
Conclusion
Implementing a focused 5-question internal client satisfaction survey for your presentation team creates a continuous feedback loop that drives improvement, strengthens relationships, and enhances the strategic value your team delivers.
The most successful presentation teams I’ve worked with view these surveys not as judgment but as invaluable guidance. Each piece of feedback represents an opportunity to better serve their internal clients and, by extension, the organization’s broader goals.
By measuring satisfaction consistently, analyzing thoughtfully, and acting decisively, your presentation team will evolve from slide producers to trusted strategic partners who amplify your organization’s most important messages.
Remember that the survey itself is just the starting point. The magic happens when you transform that feedback into tangible improvements that your internal clients experience in their next presentation project.
Related Articles
-
 November 10th, 2025
How to Interview Presentation Designers (Portfolio Review Rubric Included)
Blog Post -
 March 9th, 2020
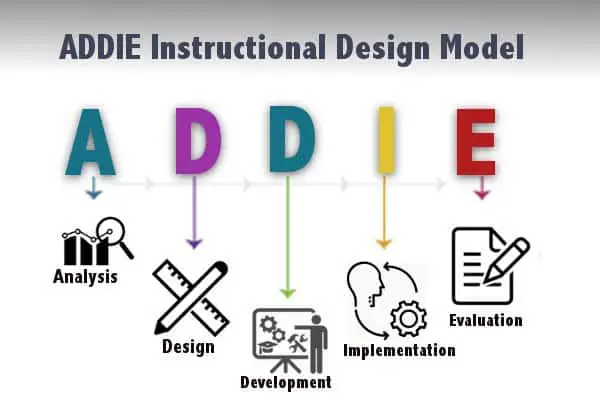
What is ADDIE Model: Instructional Design
Blog Post -
 March 11th, 2024
How to Create an Effective Presentation Outline
Blog Post