
How To Make a Circle Diagram in PowerPoint


Circle diagrams, also known as circular charts or cyclic diagrams, are a visually appealing method to illustrate cyclical processes, relationships between concepts, or data distribution. Project lifecycles, development stages, and interconnected systems are just some concepts that can be effectively illustrated through their circular format, facilitating a clear hierarchy and flow. Using circle diagram templates in your PowerPoint presentations can improve your message and draw in the audience.
This step-by-step guide will help you with the knowledge and tools to create effective circle diagrams in PowerPoint. We’ll look at two different methods to make circle diagrams that may be customized to suit different design preferences and complexity levels. We’ll also present a variety of ready-made circle diagram PowerPoint templates to help you save time and get started on your creative project.

Two Methods to Make Cycle Diagrams in PowerPoint
Method 1: Using Pie-Chart
PowerPoint’s built-in pie chart helps in creating a basic circle diagram. Here’s how to get started:
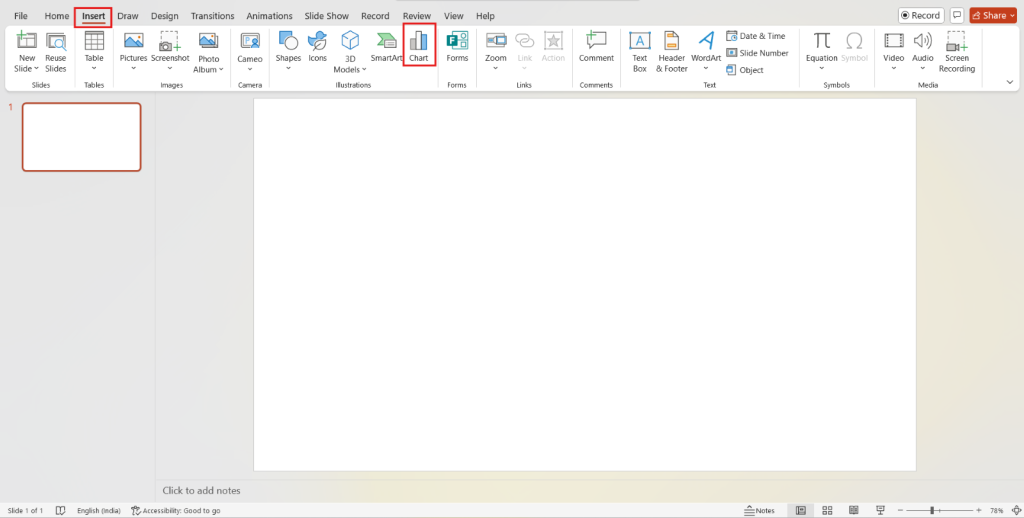
- Navigate to the Insert tab and locate the Chart.
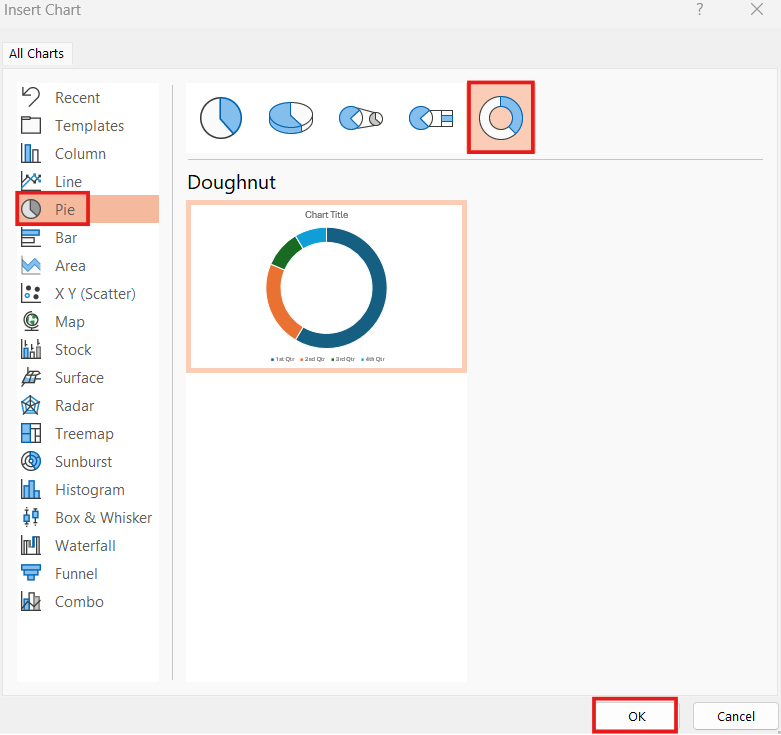
- Select Pie. Choose the pie chart format that best suits your needs and click OK.
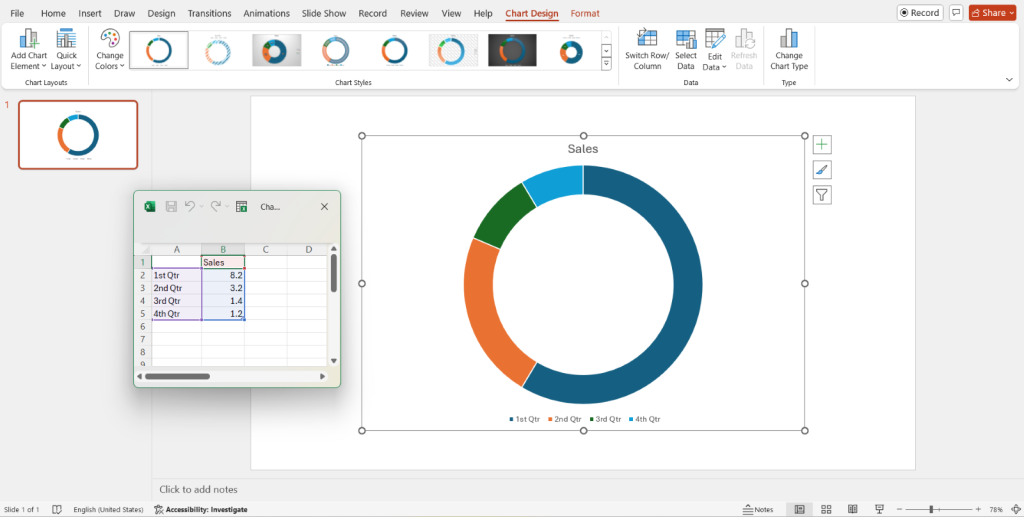
- A spreadsheet will pop up alongside the chart, allowing you to enter your data points and corresponding labels.
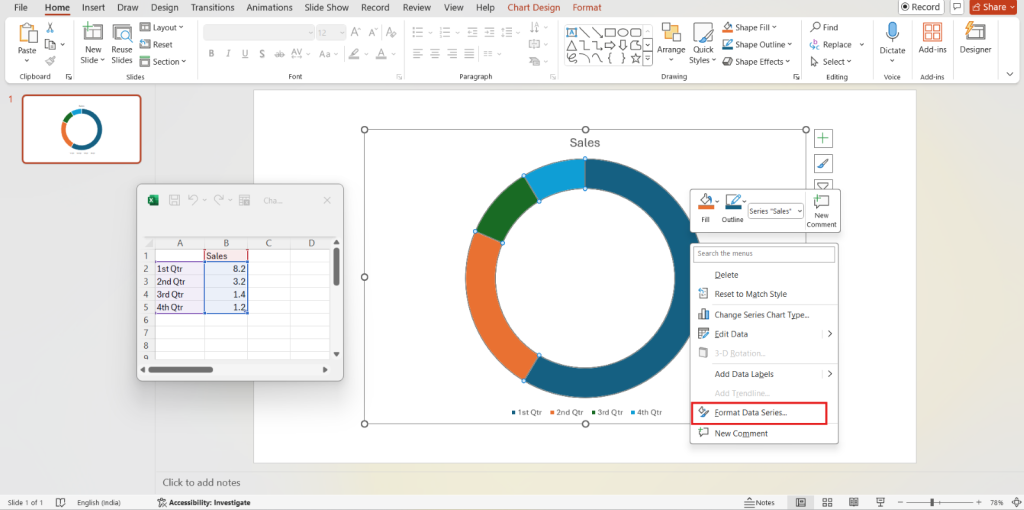
- Once your data is entered, customize the pie chart’s appearance. Right-click on the chart and select Format Data Series. This menu offers options for changing fill colors, adding borders, and modifying data labels.
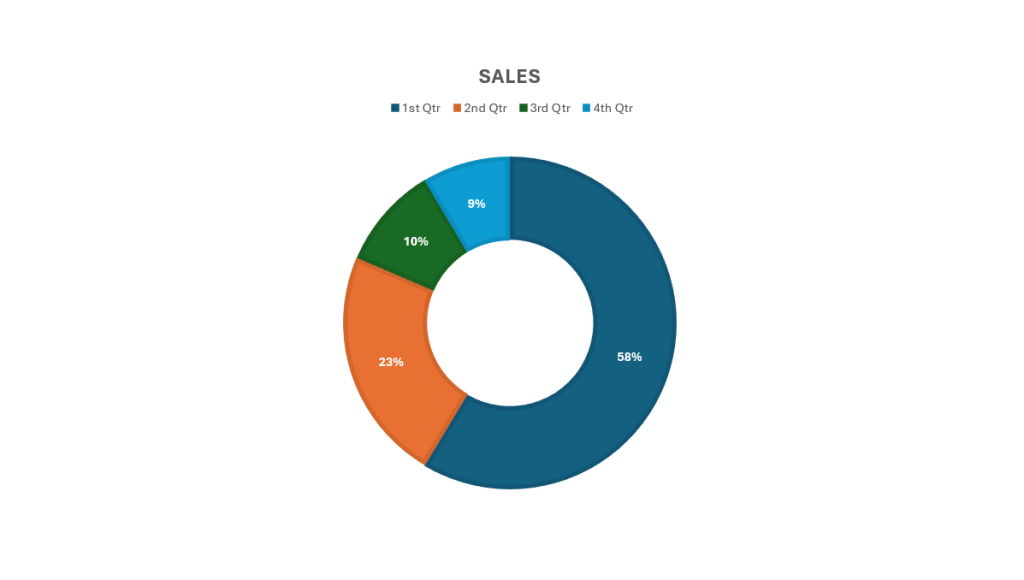
- Final output
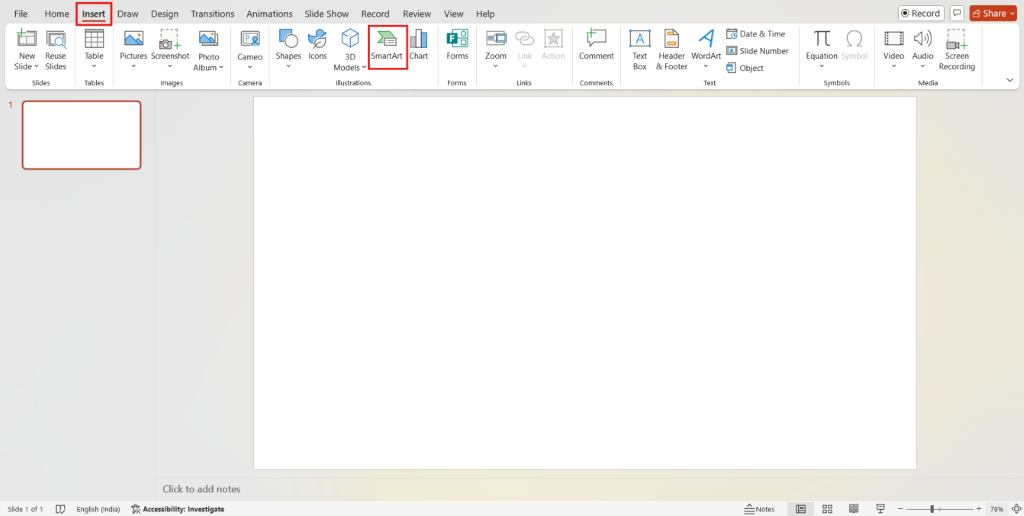
Method 2: Using Smart Art
SmartArt graphics in PowerPoint offers pre-designed layouts that can be used to create circle diagrams.
- Go to the Insert tab and select the SmartArt.
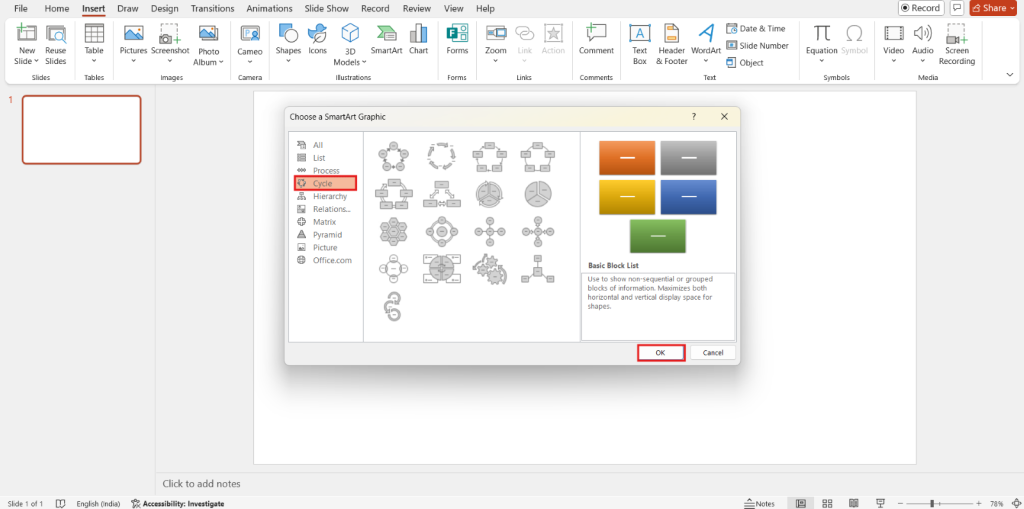
- Choose the Cycle category from the SmartArt window. Select the cycle layout that aligns with your goal of the circle diagram and click OK.
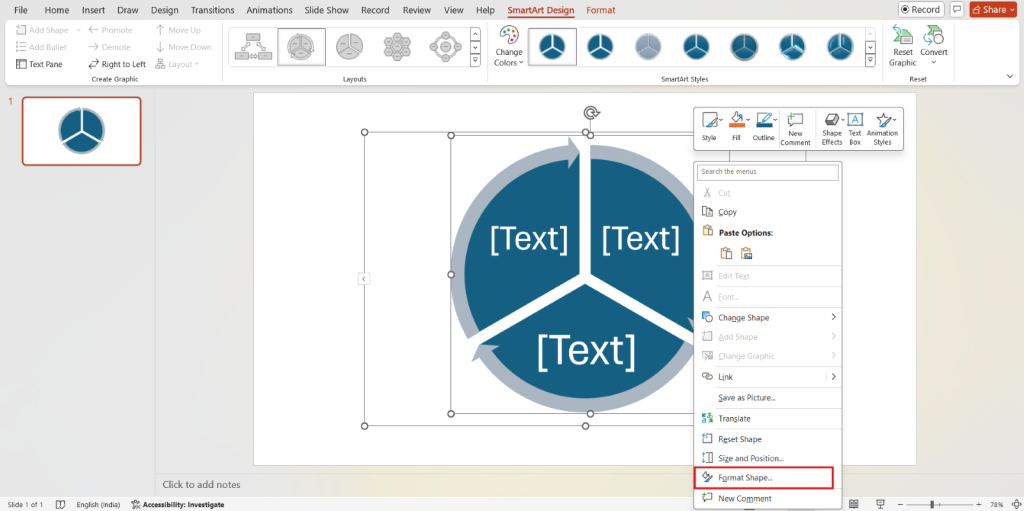
- Click on the SmartArt graphic and you can replace the placeholder text with your data. Right-click the SmartArt graphic and select the Format Shape to edit colors, fonts, and effects.
- Final Output:

Cycle Diagram PowerPoint Templates Examples
Most of us may not have the design skills or time to make an outstanding circle diagram for a presentation. This is where pre-made cycle diagram PowerPoint templates can help. These editable readymade templates are a perfect time-saving solution. Here are a few PowerPoint templates to explore:
1. Modern Cycle Process Diagram for PowerPoint
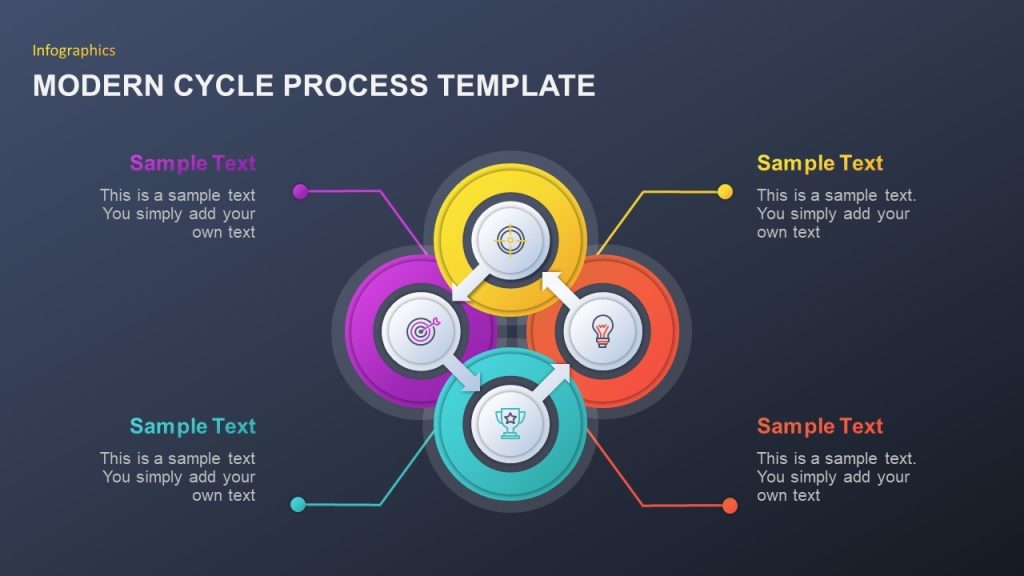
This Modern Cycle Process Diagram for PowerPoint is used to showcase the connection sequence between the elements. The four circle-shaped objects display the in-between interconnection by using pointing arrows. This PowerPoint template is suitable for showcasing project development phases or product life cycles in business presentations. You can create diagrams by explaining each step with explicit details by using the text placeholders in the template.
2. 4 Stage Cycle Process PowerPoint Template & Keynote Diagram
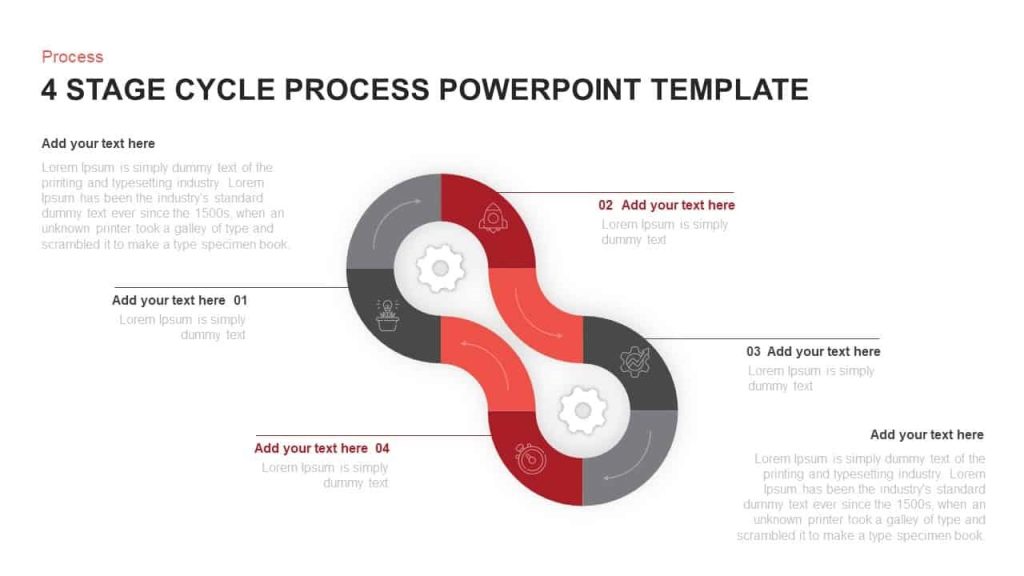
This cycle diagram is perfect for academic or business presentations. This infographic template can be used to explain the 4-step development of the business or organization strategies or plans. This template has 8 segmentations, and you can use it to create eight-point presentations by customizing the template. Since this is a process flow diagram it can be used to explain continuous processes in ongoing operations.
3. Business Life Cycle Arrow PowerPoint Template
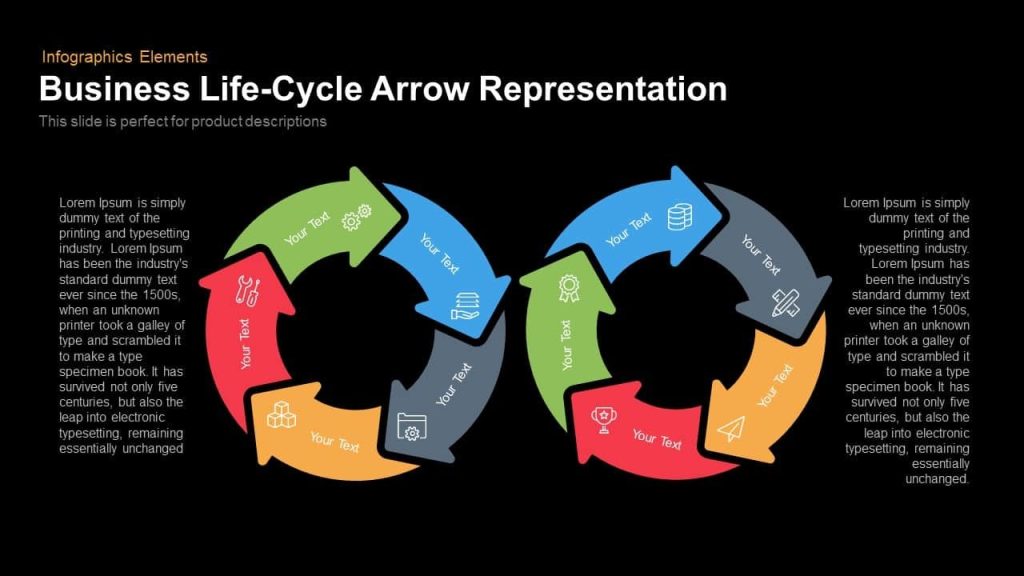
This is a perfect template for business process presentations and to explain different phases of product development. This template is generally used for the strategic planning or the analysis of a business model. You can also use this to compare two products or two strategy models. This slide is compatible with both PowerPoint and Keynote.
4. Modern Circular Infographic Template
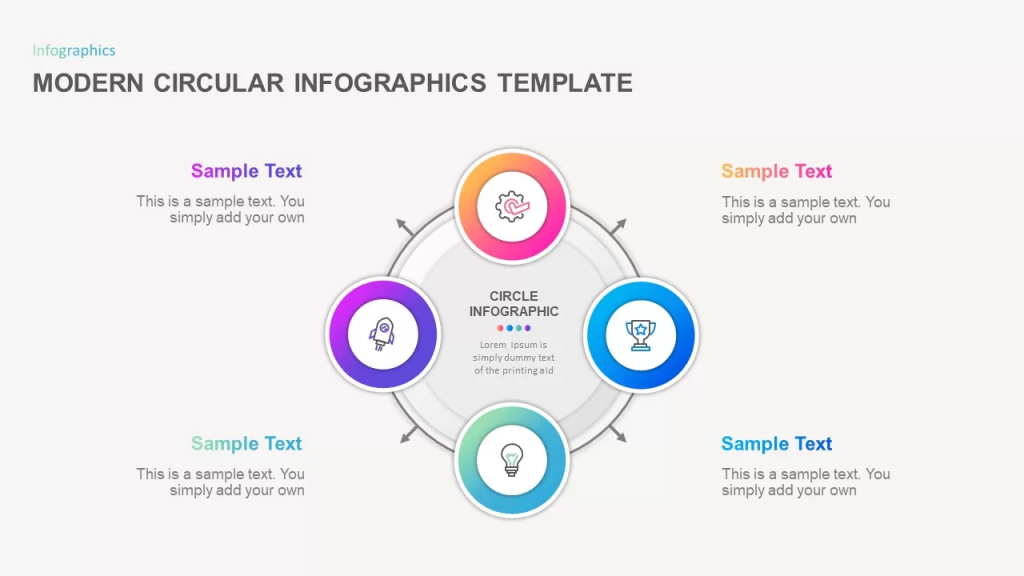
The Modern Circular Infographic template resembles a planetary orbit. This is also suitable for business or academic presentations. This template consists of four mini-circle rings with a big circle vector design. You can edit the template and customize it according to the vision of your presentation. This template can be a perfect choice for your business process presentation.
5. Cycle Object Infographic Free PowerPoint Template and Keynote Slide
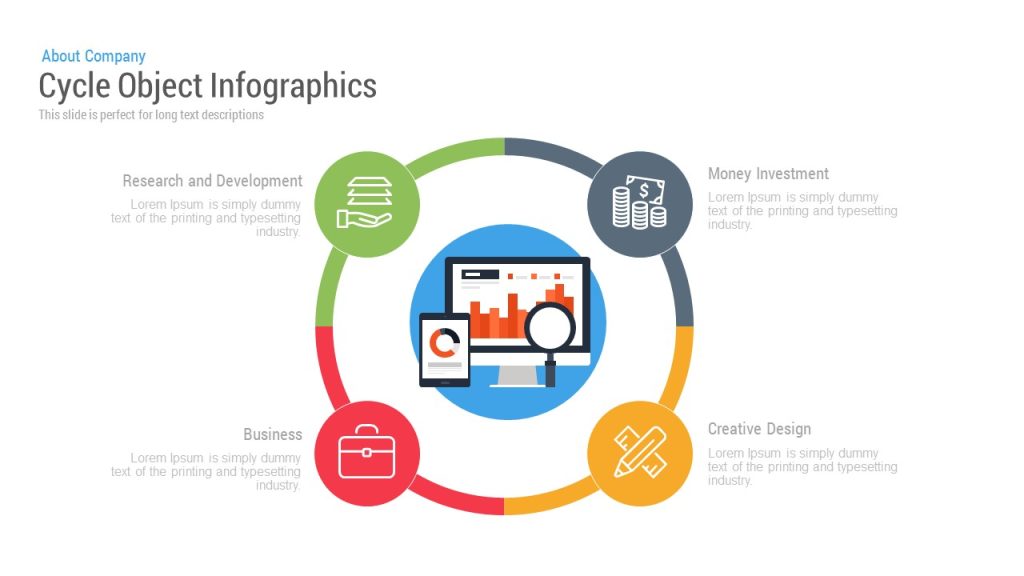
This is a 4 segmented template created for professional users from business and academic fields. You can use this template to showcase the stages and growth of business development, business processes, product features, and circular flow of a particular concept. This template offers a beautiful colorful design to create a lasting impression on the audience. As this is an editable template you can customize its colors or change the icons or shapes according to your presentation.
Wrapping Up
Now you have learned how to make a circle diagram template in PowerPoint and familiarised with some pre-made cycle diagram PowerPoint templates also. As circle diagrams can be used to present complex concepts by improving audience understanding, try more pre-made PowerPoint templates from our wide range collection of PPT templates and deliver your presentation by leaving a lasting impression. So, use the circle diagrams in your next presentation and present your complex data in a simplified format.
Related Articles
-
 June 26th, 2021
Kubler-Ross change model: how do people react when you applying change
Blog Post -
 March 20th, 2024
10+ Action plan examples for business presentation
Blog Post -
 March 16th, 2024
30+ Timeline Examples for PowerPoint
Blog Post