


Risk Management in Marketing PowerPoint template

Description
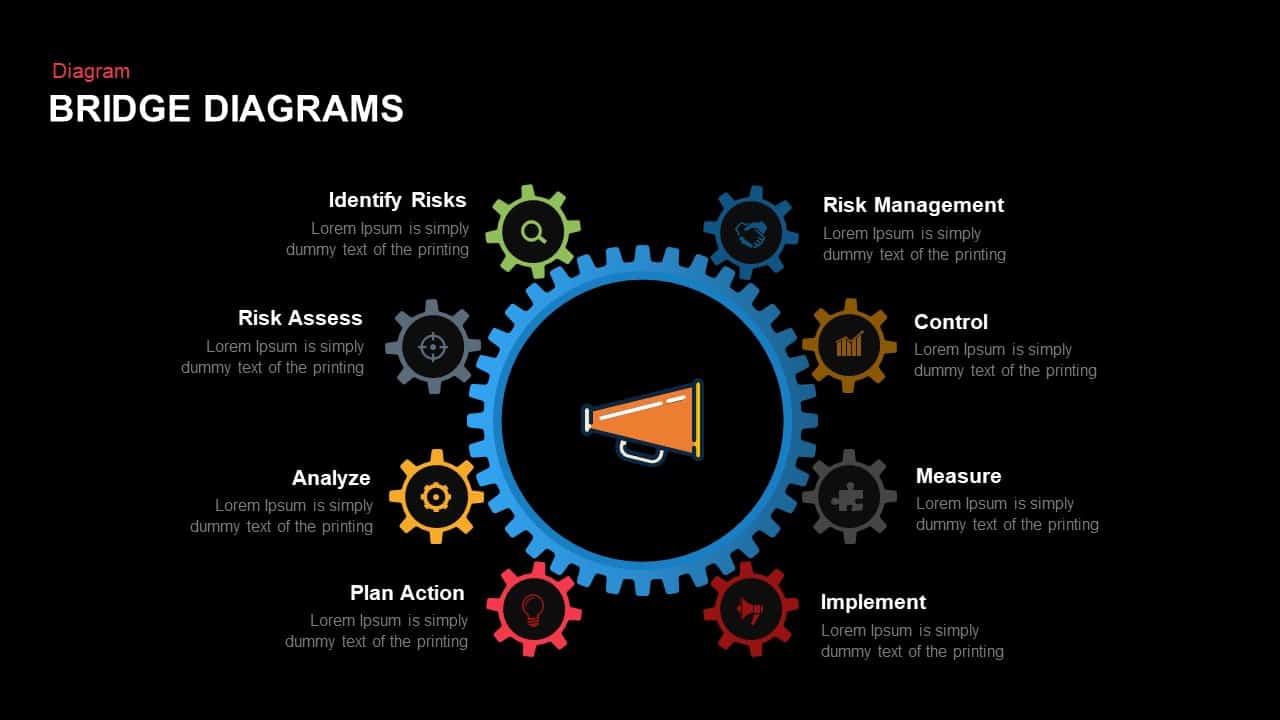
Organize your marketing risk framework with this fully editable gear diagram slide, featuring a central megaphone icon encircled by eight colored cog segments that represent each stage of your risk process. The vector-based gears—set in green, gray, yellow, red, blue, brown, and charcoal—connect seamlessly to illustrate Identify Risks, Risk Assess, Analyze, Plan Action, Implement, Measure, Control, and overarching Risk Management. Dotted connector paths guide the eye through each gear interaction, while the clean white background and crisp typography ensure readability across any screen.
Built on master slides for both PowerPoint and Google Slides, this diagram enables rapid customization of gear colors, segment order, and icon placeholders to match your brand palette. Swap out icons or resize cogs in seconds, then apply entrance animations to sequentially reveal each process step and reinforce audience engagement. High-resolution vector art guarantees perfect clarity on large displays, printed handouts, or PDF distributions. Use the spacious text zones beside each gear to detail risk thresholds, mitigation tactics, or performance metrics.
Integrate this gear network with complementary layouts—such as Gantt charts, SWOT analyses, or KPI dashboards—to maintain a consistent design language throughout your deck. Optional dark-mode variants and print-ready configurations support presentations in any environment, from boardrooms to webinars. Whether you’re mapping campaign risks, compliance workflows, or cross-functional dependencies, this vibrant gear framework brings clarity and professionalism to your marketing risk narrative.
Who is it for
Marketing leaders, risk managers, and project coordinators will leverage this slide to define and communicate risk-management processes. Consultants, data analysts, and compliance officers can also use the gear layout to align stakeholders on mitigation strategies and performance metrics.
Other Uses
Beyond marketing, repurpose this diagram to illustrate operational workflows, product development cycles, or quality-control systems. Customize each gear label and icon to highlight departmental roles, process optimizations, or innovation pipelines across any business context.
Login to download this file

Item ID
SB00927