


Pie Charts with Social Media Market Share Powerpoint template
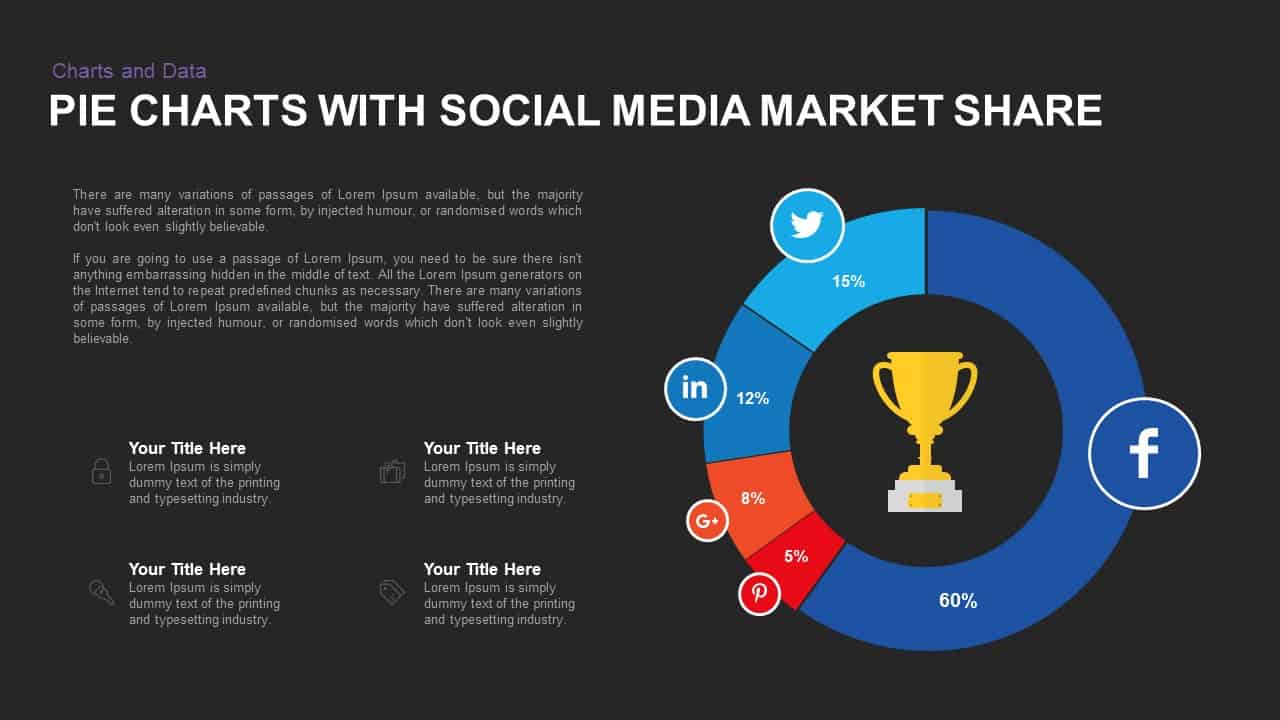

Illustrate your social media platform performance with this pie chart slide that maps market share percentages across five major networks. The donut-style chart comprises five circular segments—Facebook (60%), Twitter (15%), LinkedIn (12%), Google+ (8%), and Pinterest (5%)—each colored and icon-labeled for instant recognition. A central trophy icon highlights the leading platform, while vector-based shapes ensure full scalability. On the left, four text placeholders allow you to elaborate on metrics, insights, or strategic recommendations, complemented by minimal icon accents. The subtle gray background and thin data connectors maintain focus on the chart segments without cluttering the layout. Built on master slides with editable legends, color schemes, and labels, this asset is fully customizable in PowerPoint and Google Slides. Change percentages, swap icons, adjust segment colors, or shift text boxes in seconds—all while preserving alignment and resolution. The clean typographic hierarchy and generous white space optimize readability, making it ideal for both on-screen presentations and printed handouts. Whether you need to report quarterly KPIs, review campaign performance, or analyze competitor standings, this chart combines data clarity with professional polish.
Who is it for
Marketers, social media managers, and digital analysts will benefit from this chart when presenting platform performance, engagement trends, or audience reach. Marketing directors, agency strategists, and C-suite executives can leverage the visual clarity to align teams on channel priorities and resource allocation.
Other Uses
Beyond market share analysis, repurpose this donut chart to illustrate budget allocations, survey results, demographic breakdowns, or product feature adoption. It also works for financial reports, customer segmentation, executive dashboards, and boardroom presentations. Simply update icons and values to adapt it for any percentage-based data story.
Login to download this file
Add to favorites
Add to collection

Item ID
SB00899