


Fishbone Diagrams Powerpoint

Description
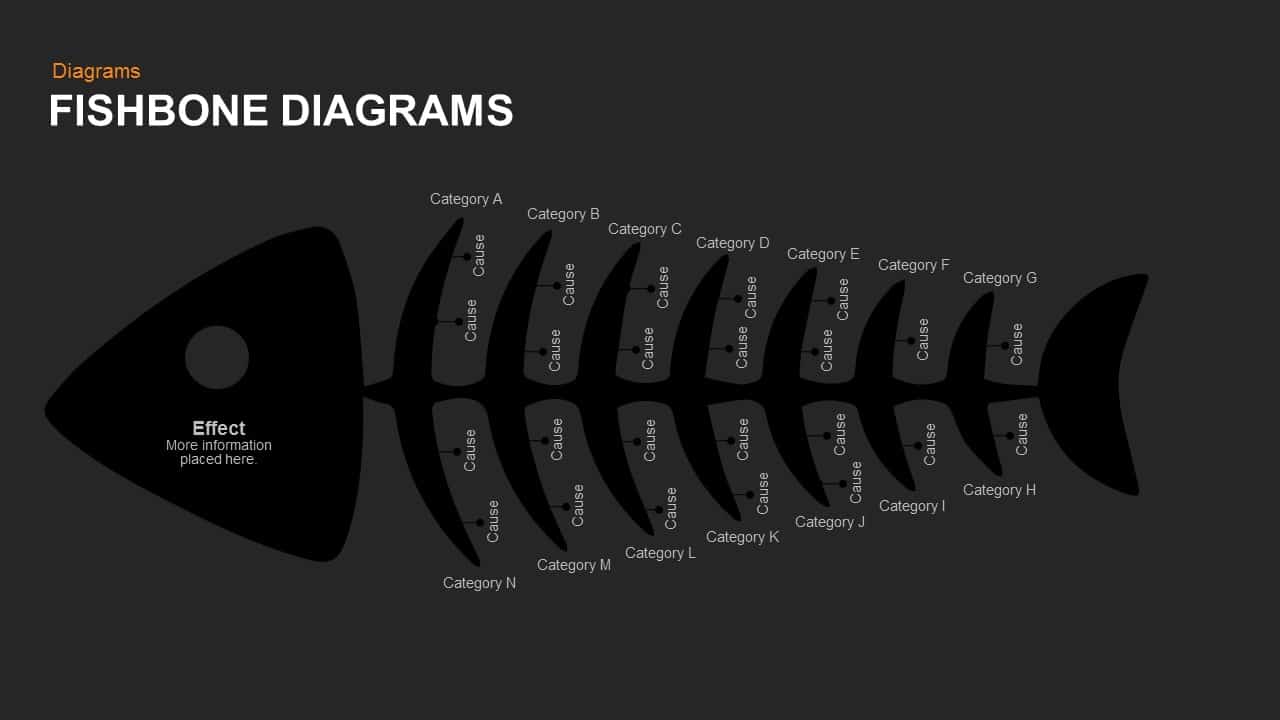
This Fishbone Diagram template provides a clear and visually engaging way to illustrate cause-and-effect relationships. The diagram's structure—resembling a fishbone—allows you to display an effect at the head of the diagram and connect multiple categories (A-N) and their causes along the "bones" of the fish. Each category can contain multiple causes, represented by small bullet points, to help you identify and categorize potential factors contributing to an issue or problem.
Perfect for root cause analysis, problem-solving sessions, or process improvement discussions, this slide helps break down complex issues into manageable sections. The template's clean design ensures easy customization, so you can replace the placeholder text with your specific data. The diagram is flexible enough to represent various industries or topics, from product defects to operational inefficiencies.
Compatible with both PowerPoint and Google Slides, this diagram is easy to edit and present on various devices. Use it for team meetings, brainstorming sessions, or as part of a larger project analysis.
Who is it for
This template is ideal for business analysts, project managers, quality control teams, and anyone involved in process improvement or problem-solving initiatives. It’s also suitable for educators and trainers who wish to teach the concept of cause-and-effect analysis.
Other Uses
In addition to process improvement, this diagram can be repurposed for use in risk assessments, failure mode analysis, project planning, or any situation requiring a breakdown of potential causes behind a given effect. It can also be adapted for lessons in cause-effect relationships, strategic planning, or product development.
Login to download this file

Item ID
SB00812