


Zimbabwe Map With provinces Powerpoint and Keynote template
Description
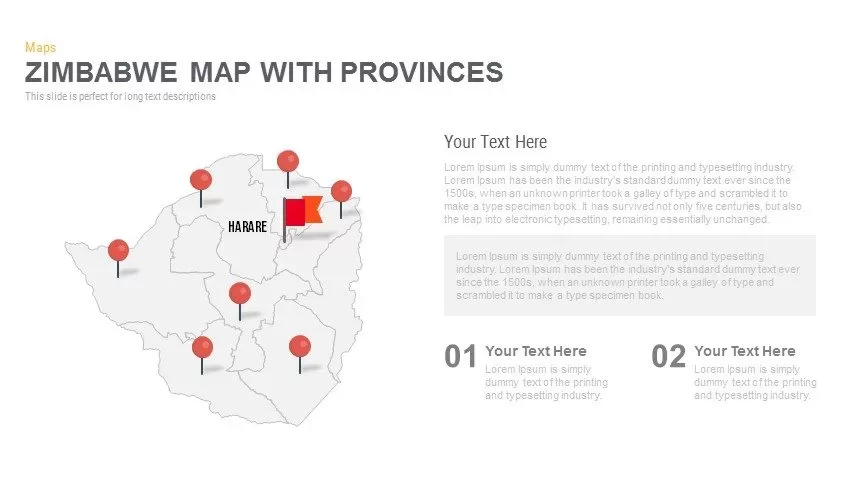
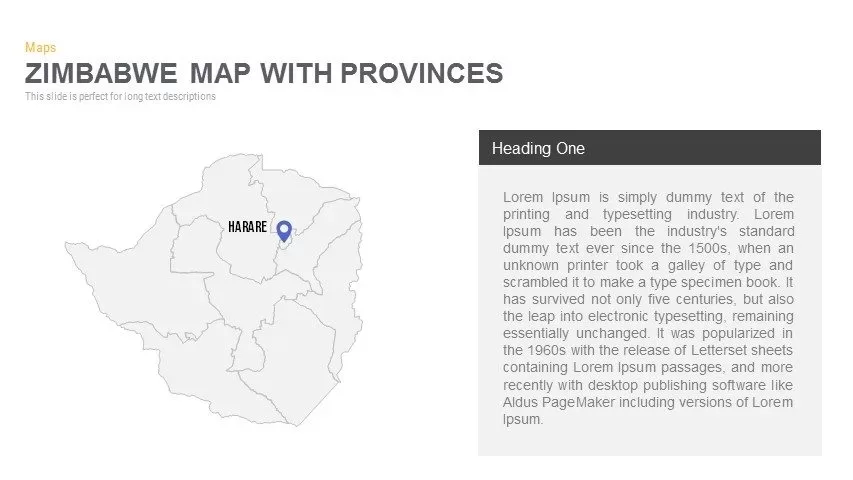
Leverage this five-slide pack to visualize provincial data across Zimbabwe with precision and style. The opening layout presents a crisp, vector outline map marked with uniform push-pins and a bold offset callout for spotlighting a key province such as Harare. The second slide pairs the map with a shaded text block and header banner for detailed regional narratives or strategic insights. The third layout integrates a multi-series bar chart beside the map, enabling clear comparisons of provincial metrics—population, resource allocation, or sales volume—in a single view. In the fourth variation, vibrant color-coded pins mark every province, supported by dual numbered callouts to outline two priority areas or initiatives. The final slide concludes with hexagonal percentage callouts and icon-based demographic statistics—perfect for illustrating gender splits, market penetration, or survey findings.
All elements are built on editable master slides in PowerPoint and Google Slides. Every map region, marker, callout, and chart remains a vector shape for razor-sharp clarity on HD screens, projectors, and mobile devices. Instantly recolor provinces to match branding, reposition markers to highlight new locations, or swap icons to reflect evolving data—no reformatting required. Snap-to-guide alignment and consistent padding ensure professional, balanced layouts throughout your deck. The neutral white background and subtle drop shadows keep focus on your visuals, while seamless cross-platform compatibility eliminates formatting headaches and accelerates team collaboration. Whether presenting regional performance analyses, planning infrastructure deployment, or sharing survey insights, this template pack streamlines storytelling and engages audiences with polished, data-rich map visuals.
Who is it for
Sales managers, market analysts, and regional planners will find this pack indispensable for visualizing provincial metrics, highlighting strategic locations, and guiding data-driven decision-making.
Other Uses
Repurpose these layouts for academic research, election result breakdowns, tourism development plans, resource allocation reports, or public policy presentations to illustrate geographic insights and regional comparisons.
Login to download this file

Item ID
SB00710