


Egypt Map With governorates Powerpoint and Keynote template 3

Description
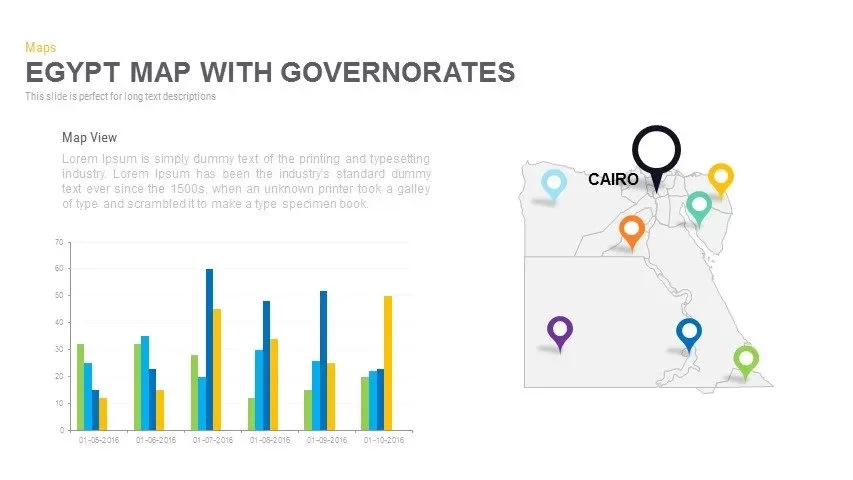
This five-slide pack delivers highly customizable maps of Egypt’s governorates with prefecture boundaries and data-driven markers. The first layout features a clean outline map accented by uniformly styled push-pins and a large offset callout panel for spotlighting a key governorate like Cairo. The second slide pairs the same map with a shaded text block and header banner for in-depth regional narratives or strategic insights. The third layout combines multi-series bar charts alongside the map, enabling direct comparisons of metrics—population density, sales volume, resource distribution—across all governorates at a glance. The fourth variation displays color-coded pins marking each region, supported by dual numbered callouts to outline two priority areas or initiatives. Finally, the pack concludes with a demographic breakdown slide featuring hexagonal percentage callouts and icon-based user statistics, perfect for illustrating gender splits, market penetration, or survey results.
All slides leverage vector-based shapes for razor-sharp clarity on HD screens, projectors, and mobile devices. Editable master layouts let you recolor regions, reposition pins, swap icons, or adjust chart data in seconds without reformatting. Snap-to-guide alignment and consistent padding ensure professional, balanced layouts throughout your deck. The neutral white background and subtle drop shadows keep focus on your data visuals, while seamless compatibility between PowerPoint and Google Slides eliminates formatting headaches and accelerates collaborative editing. Whether you’re presenting regional performance, planning infrastructure deployment, or visualizing survey findings, this template pack streamlines storytelling and keeps your audience engaged with polished, data-rich visuals.
Who is it for
Sales managers, market analysts, and regional planners will find this template indispensable for visualizing governorate-level metrics, highlighting strategic locations, and guiding data-driven discussions.
Other Uses
Repurpose these layouts for election result breakdowns, tourism development plans, resource allocation reports, academic research presentations, or public policy analyses to illustrate geographic insights across Egypt’s regions.
Login to download this file

Item ID
SB00706