


Rectangular Factors Diagram Powerpoint and Keynote template 1

Description
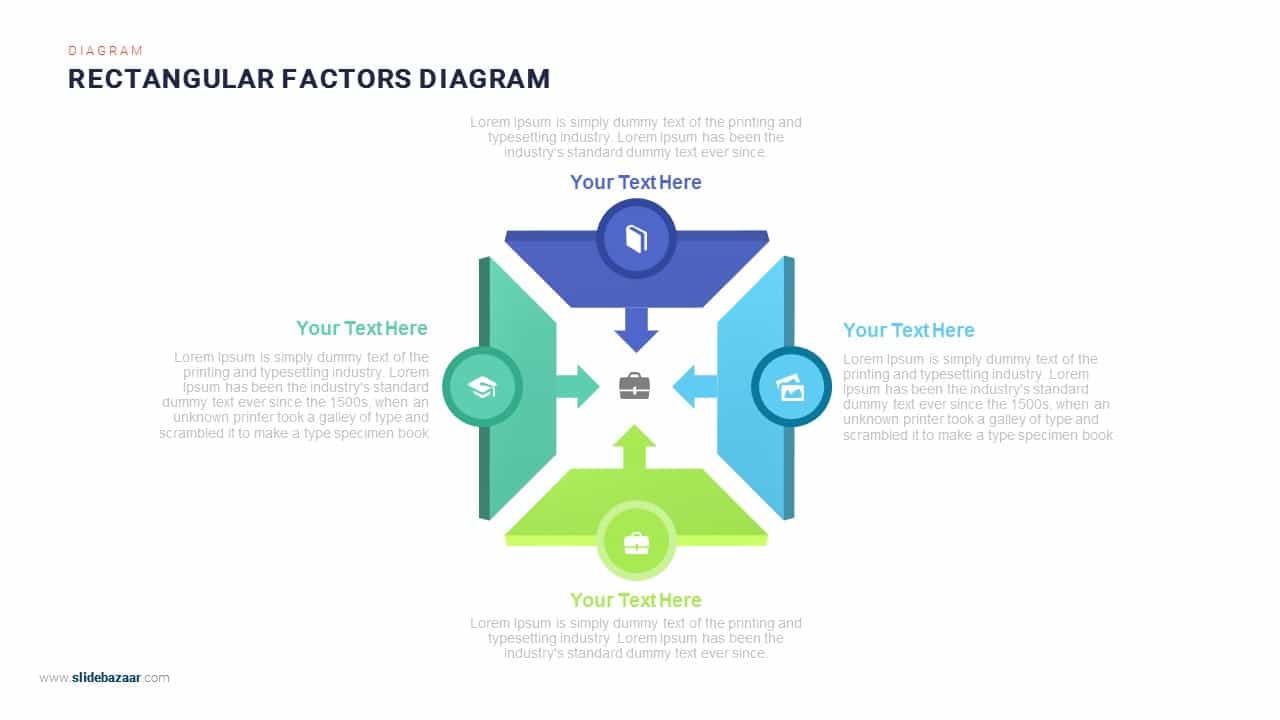
This four-arrows rectangular factors diagram slide visualizes four key drivers or components converging on a central concept. Each colored trapezoid arrow—blue, teal, lime green, and cyan—points toward a central icon placeholder, while adjacent text boxes provide space for headings and detailed explanations. The balanced, symmetrical layout on a clean white background ensures your audience’s focus remains on the relationship between each factor and the core theme.
Built on fully editable master slides for PowerPoint and Google Slides, this layout includes vector-based arrows, circle icon placeholders, and text boxes. Smart guides and alignment tools guarantee precise positioning, while the shape-formatting pane lets you swap icons, adjust arrow angles, or customize color palettes in seconds. Text placeholders support rich formatting, so you can update fonts, bullet styles, or color accents without disturbing the overall design.
The template offers multiple theme variants for consistent branding across different topics or departments. Use the central circle for a logo, KPI, or milestone marker, and repurpose the surrounding arrows to highlight processes, services, metrics, or product features. Whether you’re mapping strategic initiatives, risk factors, market segments, or departmental responsibilities, this slide adapts seamlessly to your narrative.
Optimized for high-resolution screens, the slide maintains crisp clarity on desktop, tablet, and mobile devices. Export smoothly to PDF, PNG, or JPEG formats for print collateral, social media graphics, or handouts. The lightweight file size and streamlined structure minimize versioning issues, accelerate editing time, and simplify collaboration across distributed teams.
Drag-and-drop functionality enables quick icon replacement or custom graphic imports, while preconfigured placeholder sizes ensure consistency across your deck.
Who is it for
Consultants, project managers, marketers, and business analysts who need to illustrate how multiple factors or components integrate around a central theme in a clear, professional diagram.
Other Uses
Illustrate risk assessments, process inputs, departmental roles, SWOT factors, service offerings, product features, or system components in boardroom presentations, training workshops, and investor pitches.
Login to download this file
Add to favorites
Add to collection

Item ID
SB00625