


4 Arrows PowerPoint Template
Description
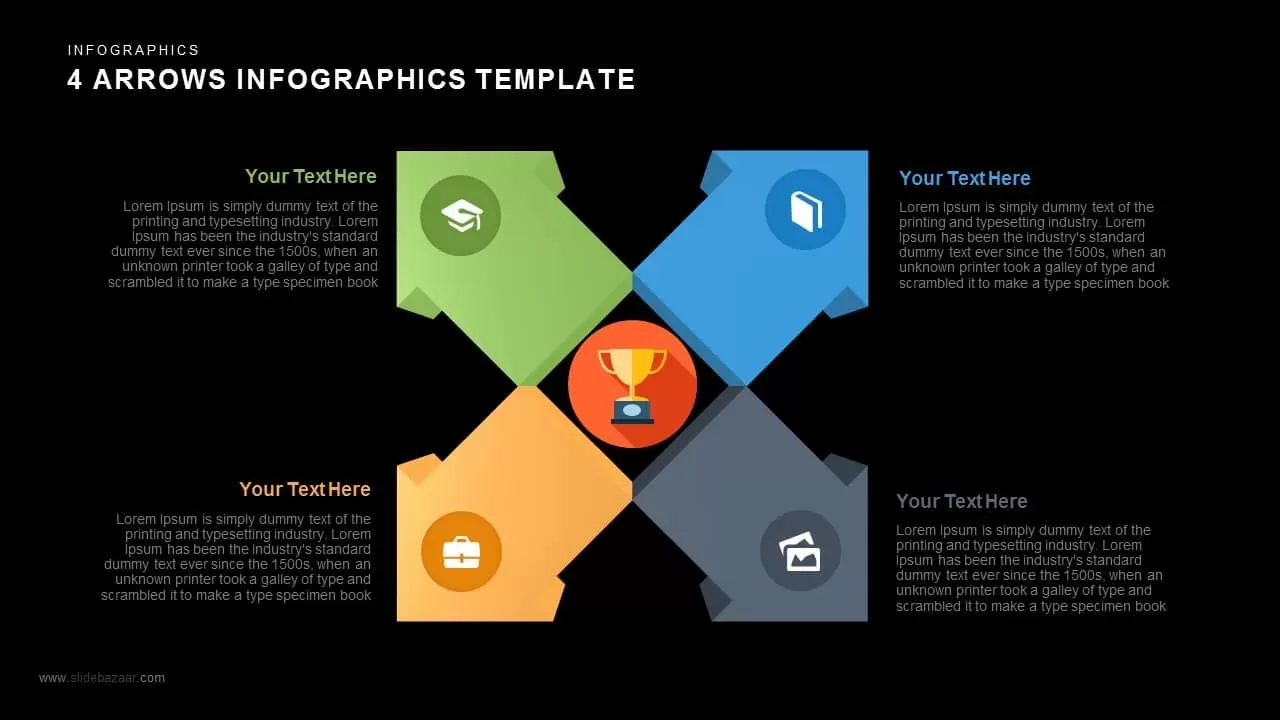
This four-arrows infographic slide presents a dynamic layout with four colored arrow shapes radiating around a central circle icon. Each arrow includes an icon placeholder and corresponding text box, allowing you to illustrate sequential steps, process stages, or key focus areas with clarity and visual appeal. The arrows are arranged diagonally, alternating above and below the central circle to create a balanced composition on a clean white background.
Built on editable master slides for PowerPoint and Google Slides, this design features fully scalable vector arrows, icon placeholders, and text boxes. Smart guides and alignment tools ensure precise placement, while the shape-formatting panel makes it easy to customize arrow colors, swap icons, or adjust sizes and positions without compromising the layout’s integrity. Text placeholders support rich formatting, so you can effortlessly update headings and body copy.
The template supports multiple theme variants, enabling consistent branding across different topics or departments within the same deck. The central circle can display a logo, KPI, or milestone marker, while the surrounding arrows highlight related descriptions, metrics, or visuals. Whether you’re mapping strategic initiatives, marketing channels, performance metrics, or training modules, this flexible slide adapts to your narrative.
Optimized for high-resolution screens, the slide maintains crisp clarity on desktop, tablet, and mobile devices. Export smoothly to PDF, PNG, or JPEG formats for handouts, social media, or print collateral. The lightweight file size and streamlined design help prevent version-control issues, reduce editing time, and simplify collaboration across dispersed teams.
Drag-and-drop functionality enables you to replace icons or import custom vector graphics, while preconfigured slide layouts and placeholder sizes guarantee consistency across your presentation.
Who is it for
Project managers, marketing teams, trainers, consultants, and business analysts who need to break down processes, highlight key areas, or showcase sequential stages in a visually engaging format.
Other Uses
Repurpose this infographic to illustrate product features, service offerings, team roles, risk assessments, SWOT factors, or milestone overviews in corporate decks, educational presentations, and sales pitches.
Login to download this file
Add to favorites
Add to collection

Item ID
SB00624