


linear-timeline-infographics-powerpoint-and-keynote-template1
Description
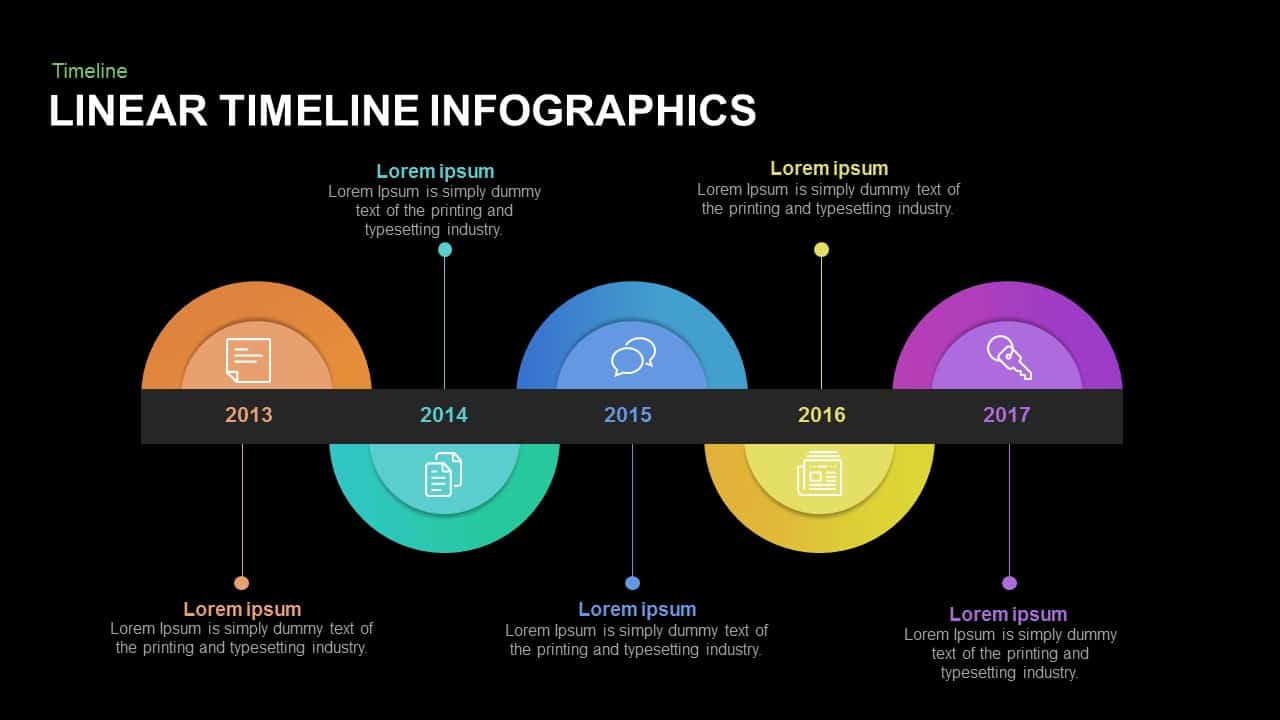
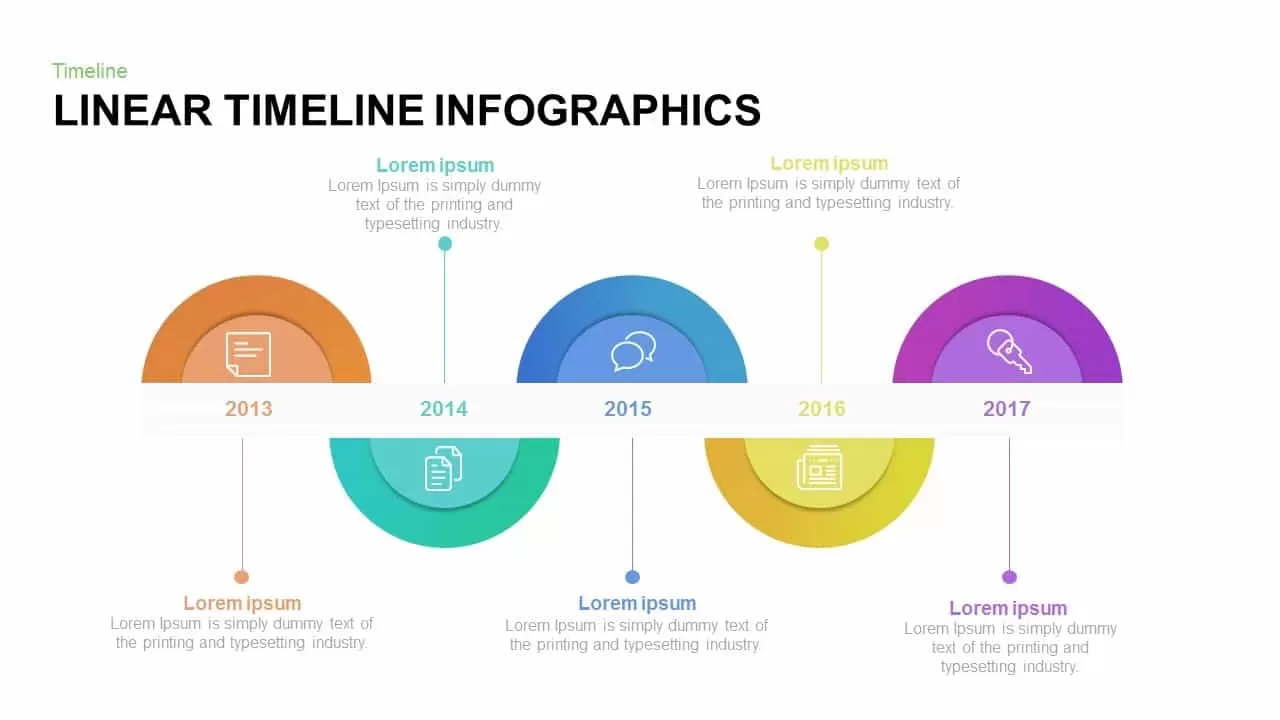
Leverage this versatile horizontal linear timeline infographic slide to map sequential milestones, project phases, or historical overviews with professional clarity and modern flat aesthetics. A sleek line runs across the canvas, punctuated by evenly spaced circular markers—each housing a vector icon placeholder, numbered label, and optional date field. Below each marker, headline and text placeholders enable concise descriptions of key events, deliverables, or KPI highlights. Distinct, fully editable color fills differentiate milestones, while precision snap-to-grid alignment and subtle drop shadows maintain a clean layout that ensures readability in data-rich presentations.
Built on master slides with fully editable vector shapes, this template grants complete design control: adjust line curvature, reposition markers, swap icons from an embedded library of over 50 vector symbols, or import custom artwork without loss of fidelity. Recolor marker rings, modify typography styles, and apply gradient or solid-fill themes via theme variants to match any corporate palette. Intuitive placeholders and locked alignment guides streamline content updates, making it easy to duplicate, remove, or reorder timeline segments. The modular framework supports expansion beyond the default five stages—simply copy existing nodes to extend project roadmaps or condense the sequence for streamlined narratives.
Optimized for both PowerPoint and Google Slides, the slide preserves high-definition clarity across devices and aspect ratios, eliminating formatting headaches in cross-platform workflows. Collaborative cloud editing features enable real-time review and iteration, while optional data callouts and percentage markers can be added alongside markers to showcase metrics, milestones, or progress indicators. The template includes light and dark variants on the master slides, enabling rapid theme switching that aligns with your presentation style. Use the built-in connector arrows or timeline grid backgrounds to highlight dependencies and durations, ensuring stakeholders can easily interpret project timelines and critical path analyses.
Who is it for
Project managers, business analysts, marketing teams, product owners, and consultants will benefit from this slide when presenting project timelines, campaign schedules, roadmap overviews, or historical milestones in executive briefings and stakeholder meetings.
Other Uses
Repurpose this horizontal timeline for training schedules, event planning checkpoints, compliance deadlines, editorial calendars, or onboarding sequences. Adjust marker counts, icons, and date formats to suit any chronological narrative or data-driven presentation.
Login to download this file

Item ID
SB00610