


four-staged-textbox-powerpoint-and-keynote-slide-1
Description
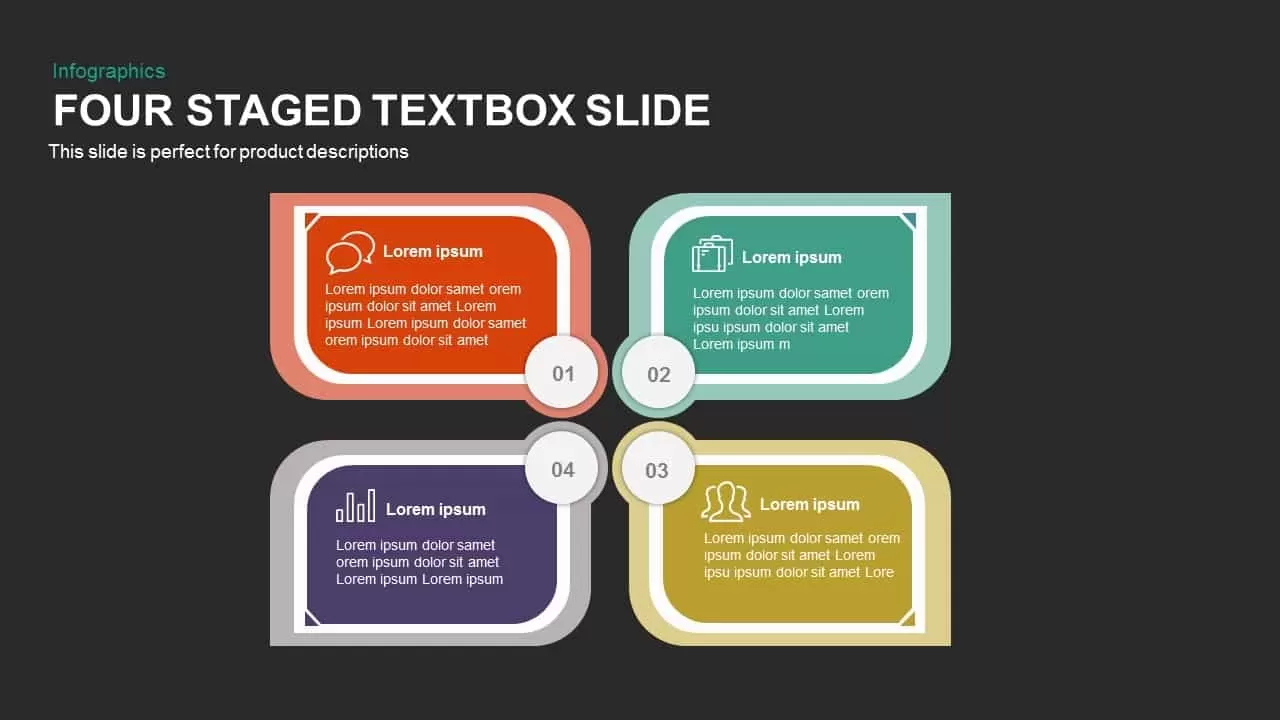
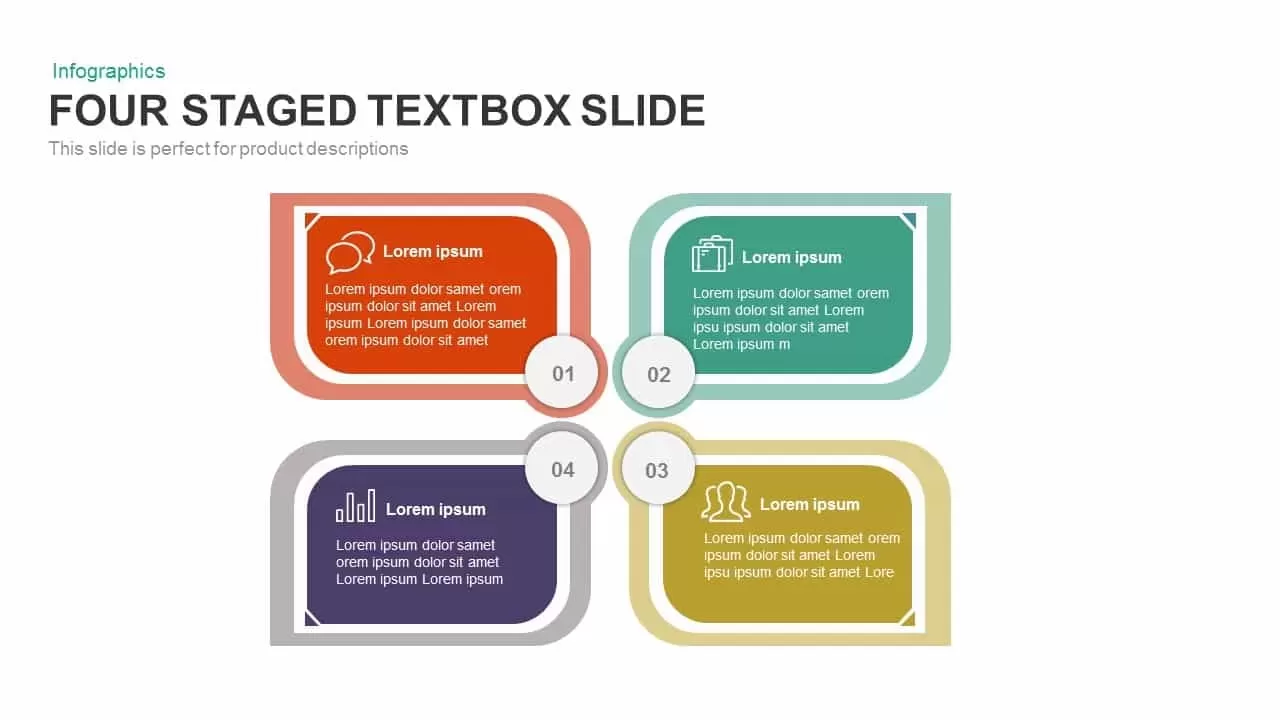
Leverage this dynamic four-stage textbox infographic slide to showcase four distinct concepts, features, or metrics with clarity and visual impact. The design arranges four rounded-corner text boxes in a quadrant around a central vertical spine, each box featuring an editable vector icon placeholder, bold headline, and concise description area. Color-coded by default, the segments guide viewers through your narrative, while generous white space ensures readability and prevents clutter.
Fully built on master slides using crisp vector shapes, this template delivers seamless scalability and proportional integrity: easily swap icons from the embedded 50+ symbol library, adjust box sizes, or apply custom brand color palettes without losing fidelity. Precision snap-to-grid alignment guides and optional drop shadows add subtle depth and perfect symmetry. Intuitive content placeholders streamline text and media updates, and locked layout guides maintain design consistency even during collaborative cloud-based editing in PowerPoint and Google Slides.
Optimized for high-definition clarity across devices and resolutions, this infographic excels in data-rich presentations where organization and visual appeal matter. Whether presenting product feature sets, process steps, service categories, or quarterly objectives, the modular framework supports duplication or removal of boxes to tailor the layout to any four-point framework. Instantly adapt the slide for competitive analyses, SWOT quadrants, risk assessments, KPI dashboards, or training agendas, making it an indispensable asset for corporate and educational decks.
Who is it for
Marketing managers, product teams, consultants, project managers, and business analysts will find this slide invaluable for presenting product features, process steps, service categories, or quarterly objectives in stakeholder briefings, sales decks, and training sessions.
Other Uses
Beyond feature breakdowns, repurpose this slide for SWOT quadrants, risk assessments, competitive comparisons, or departmental overviews. Adjust the color fills and iconography to illustrate KPI dashboards, project milestones, client segments, or agenda topics across any corporate or educational presentation.
Login to download this file
Add to favorites
Add to collection

Item ID
SB00590