


continuous-improvement-cycle-powerpoint-and-keynote-template1
Description
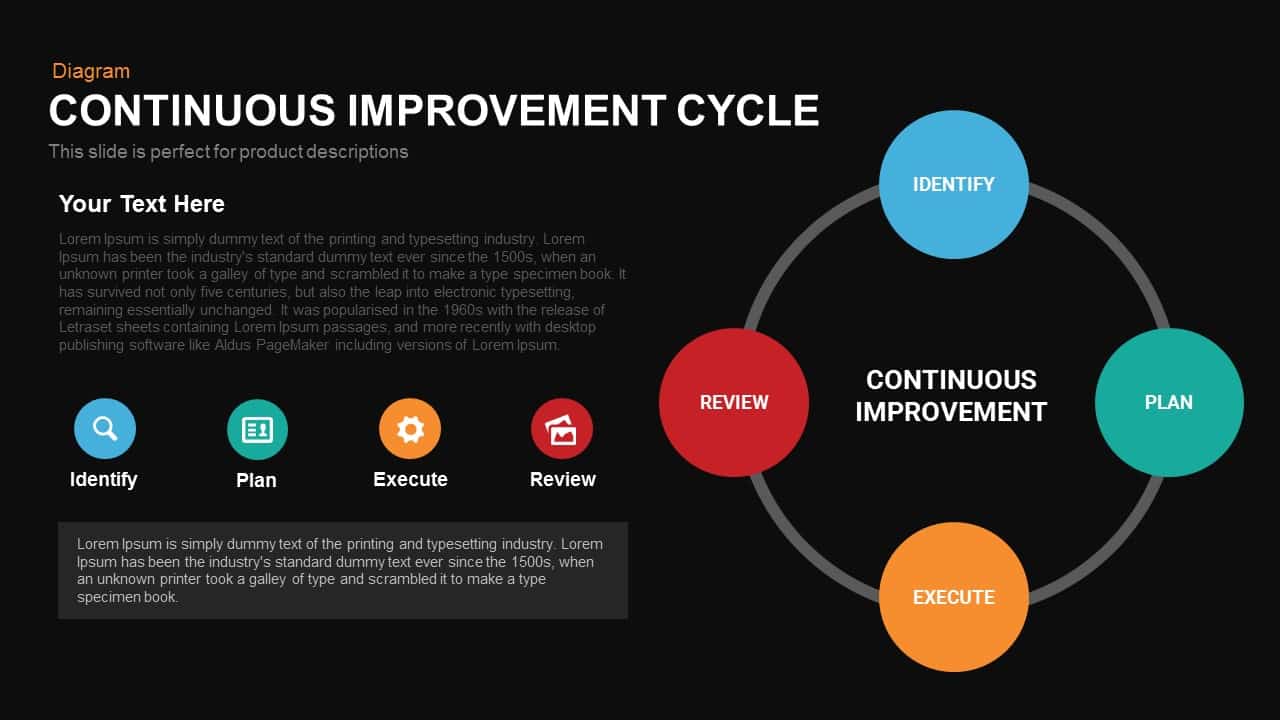
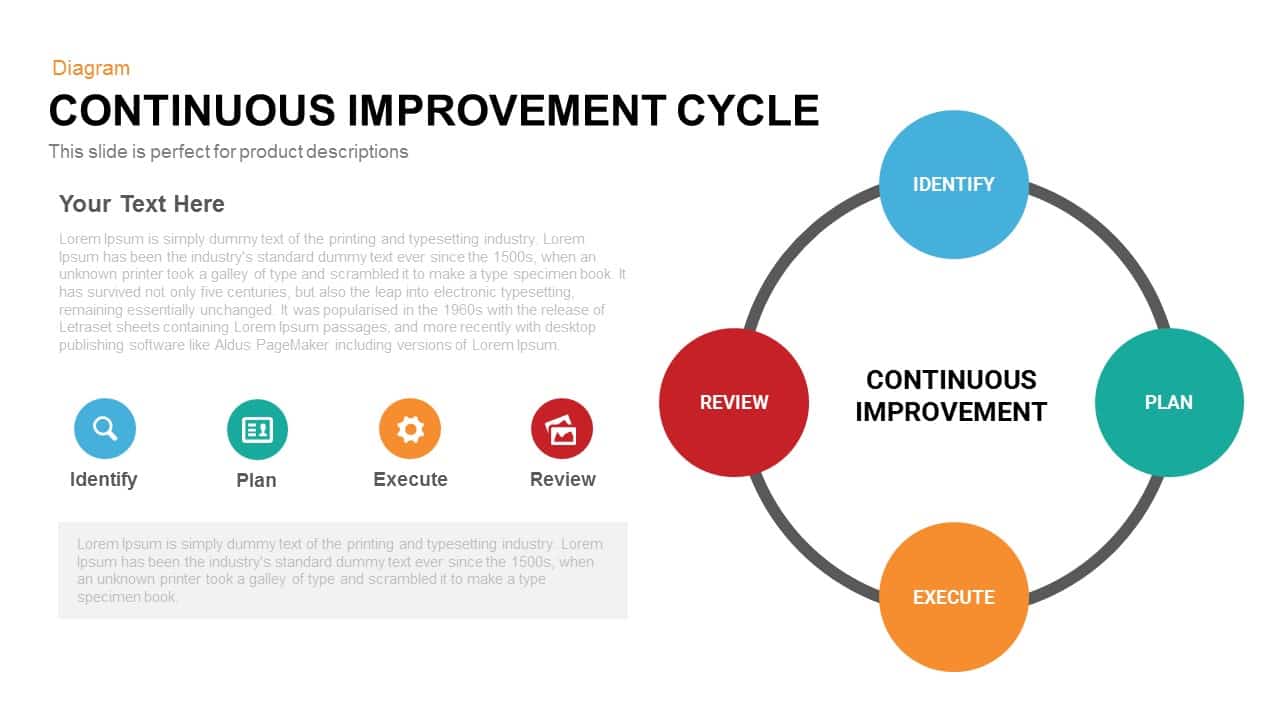
Leverage this continuous improvement cycle slide to visualize iterative development processes, quality management frameworks, and performance optimization strategies with clarity and impact. The slide centers on a four-step circular diagram representing the Plan-Do-Check-Act model, rendered in vibrant vector segments—colored in blue, green, yellow, and orange—connected by directional arrows that guide viewers through each phase. Each segment features an icon placeholder, percentage markers or milestone indicators, and editable text fields for concise annotations. The open center provides space for a core KPI or overarching title, while surrounding text boxes accommodate contextual notes or strategic objectives. The flat design aesthetic, crisp typography, and balanced white space ensure readability and professional polish across any presentation environment.
Built on master slides for both PowerPoint and Google Slides, this template leverages vector shapes, preformatted chart objects, and theme-linked color swatches to simplify customization. Swap icons, adjust segment counts, update data labels, and recolor segments in seconds without pixelation. Safe-zone guides, light/dark background variants, and optional entrance animations streamline design consistency and enhance audience engagement. Whether delivering strategic briefs, training workshops, or boardroom reviews, this asset empowers you to present complex lifecycle information in a structured, visually appealing format.
The intuitive drag-and-drop controls and uniform slide formatting reduce setup time and maintain brand coherence across multi-slide decks. With seamless cross-platform compatibility and full-resolution fidelity, your continuous improvement narratives will maintain clarity on any device. Use this versatile cycle diagram as the cornerstone of process optimization presentations, quality assurance reports, and operational excellence initiatives to drive stakeholder alignment and data-driven decision-making.
Who is it for
Business leaders, quality managers, and project teams will benefit from this cycle diagram to illustrate iterative improvement models, performance metrics, and process optimization strategies. Consultants, educators, and operational excellence practitioners can leverage its clear, step-by-step format to align stakeholders and drive data-driven continuous improvement initiatives.
Other Uses
Beyond PDCA models, repurpose this slide for product development lifecycles, customer feedback loops, risk management processes, or agile sprint retrospectives. Adapt icons and text placeholders to map sales funnels, training modules, or change management frameworks.
Login to download this file
Add to favorites
Add to collection

Item ID
SB00516