


CSAT vs NPS Comparison PowerPoint Template Dark
Description
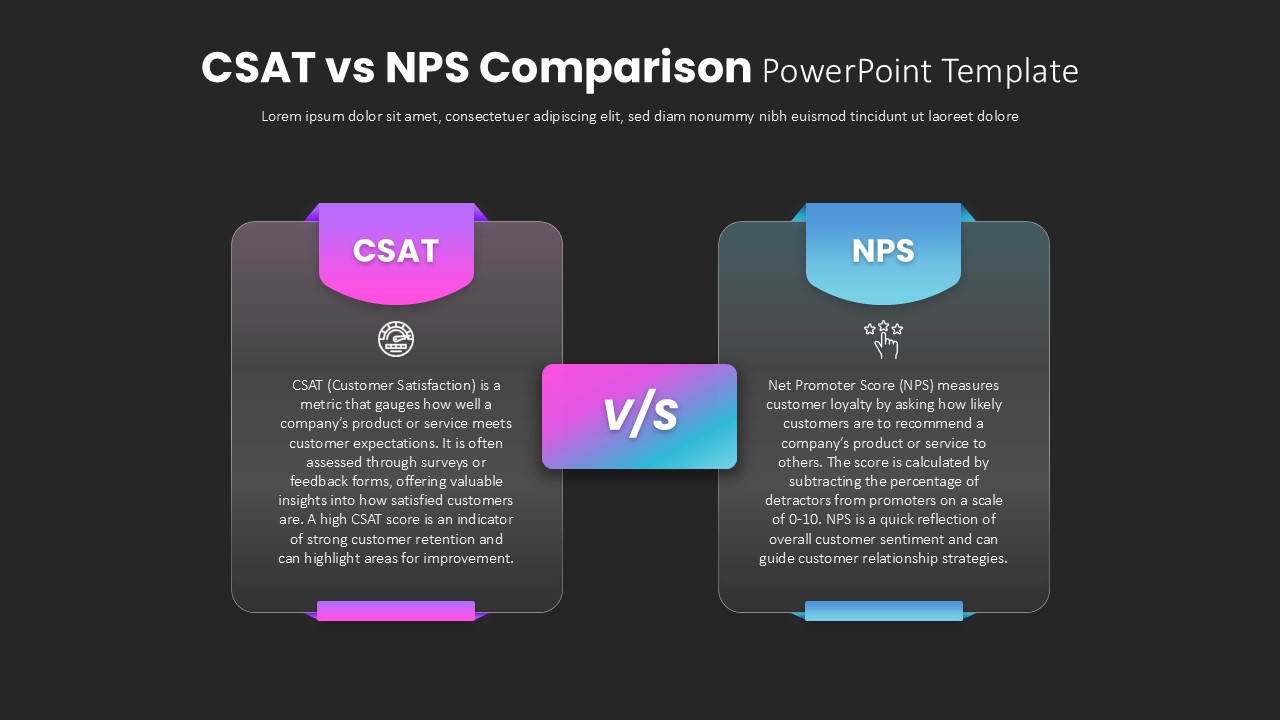
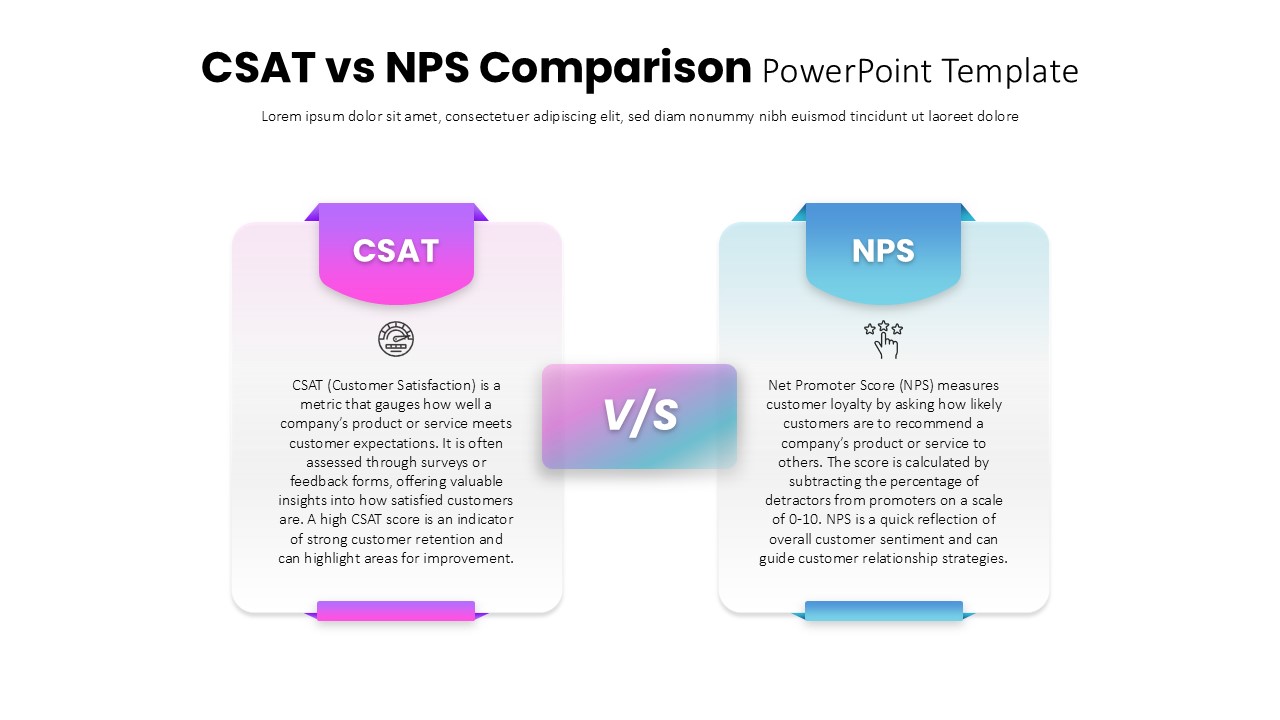
This slide provides a clear and visually engaging comparison between CSAT (Customer Satisfaction) and NPS (Net Promoter Score), two essential metrics for evaluating customer feedback and loyalty. On the left side, the CSAT section is designed with a vibrant purple background, offering an overview of the metric, which measures how well a company’s product or service meets customer expectations. The right side, in blue, introduces NPS, which gauges customer loyalty by assessing how likely customers are to recommend a company’s product or service. In between, a central "v/s" icon symbolizing the comparison between the two metrics is highlighted with a gradient of purple and blue.
The clean, modern design incorporates icons for each metric, making the slide not only informative but also visually appealing. The layout is structured to highlight key definitions, providing easy-to-read text blocks and a balanced color scheme. Whether you're presenting customer satisfaction trends or planning strategic initiatives based on customer loyalty data, this slide is perfect for discussions that require a clear, concise comparison.
Designed for both PowerPoint and Google Slides, this template ensures high compatibility across platforms, allowing for quick edits and seamless integration into your presentations. Its versatility makes it suitable for use in corporate meetings, marketing strategy sessions, and customer analysis reports.
Who is it for
This template is ideal for business professionals, marketers, customer success teams, and analysts who need to present or compare customer satisfaction and loyalty metrics. It is also beneficial for management teams, consultants, and anyone involved in customer experience strategy, aiming to convey clear, actionable insights.
Other Uses
Beyond customer satisfaction and loyalty comparisons, this slide can be adapted to showcase various performance metrics, customer feedback analysis, or competitor comparisons. It can also be customized to compare other customer experience measures or used as part of a broader business strategy presentation.
Login to download this file

Item ID
SB04987