search

Essentials

Must-have decks for quick wins

By Industry

Professionally tailored slides for every sector

By Style

Minimal, modern and creative designs

By Topic

Explore slides curated by purpose and theme

TimelineTimelineRoadmapRoadmapStrategyStrategyGoalsGoalsTableTableComparisonComparisonSWOTSWOTAgendaAgendaArrowArrowWorld MapWorld MapMapsMapsProcessProcessFunnelFunnelTeamTeamOrg ChartOrg ChartPyramidPyramidCircularCircular

Business PlanBusiness PlanBusiness StrategyBusiness StrategyBusiness ProposalBusiness ProposalBusiness ModelsBusiness ModelsDigital MarketingDigital MarketingMarketing FunnelMarketing FunnelCustomer ExperienceCustomer ExperienceProject StatusProject StatusGantt ChartGantt ChartRecruitmentRecruitmentEmployee PerformanceEmployee PerformanceLeadershipLeadershipAIAIMachine LearningMachine Learning

AI Presentation Maker

Install the Windows plugin for quick access to templates and design tools.

AI Infographics Maker

Use our Office 365 add - in to access templates directly from the cloud.

Exe Version

Install the Windows plugin for quick access to templates and design tools.

Office 365

Use our Office 365 add - in to access templates directly from the cloud.

Mac Version

Get the Mac plugin to easily browse, insert, and customize templates and visuals within PowerPoint.

pros-and-cons-template-powerpoint-google-slides

pros-and-cons-template-powerpoint-google-slides
This template is part of a deck featuring multiple slides. To check out all slides, click on See All. See All round right arrow
pros-and-cons-template-presentation-powerpoint-google-slides

Description

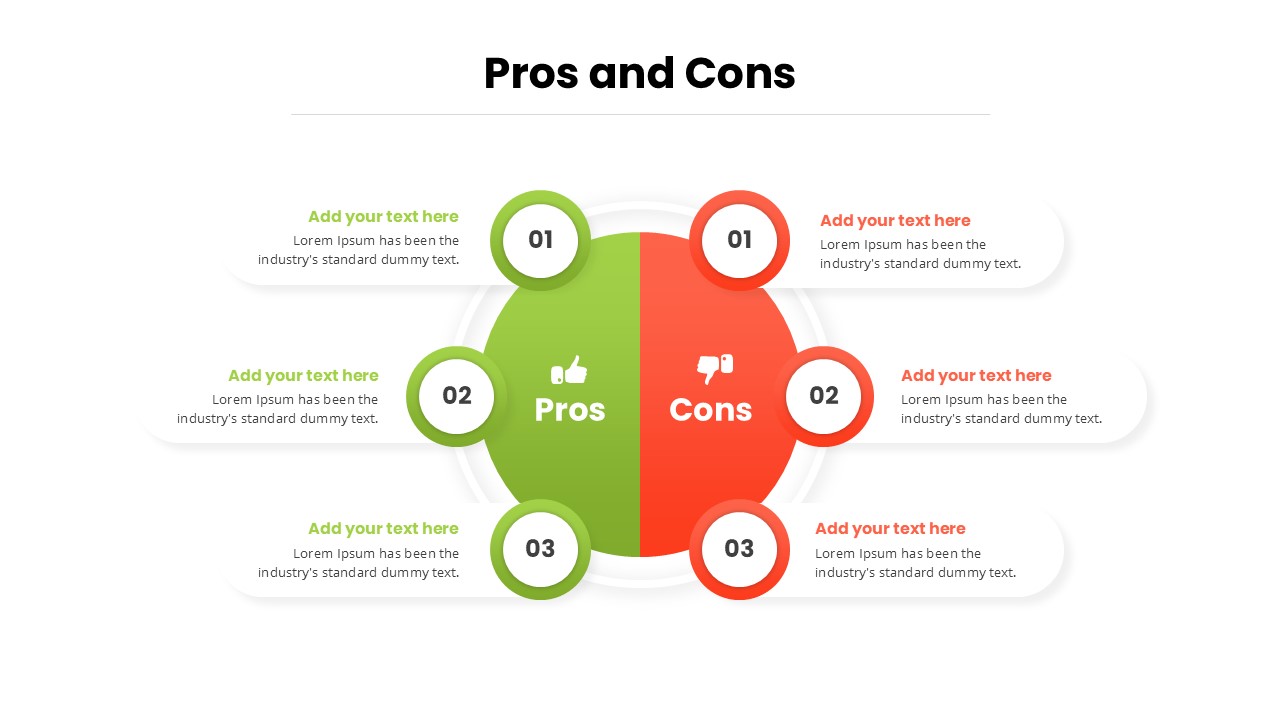
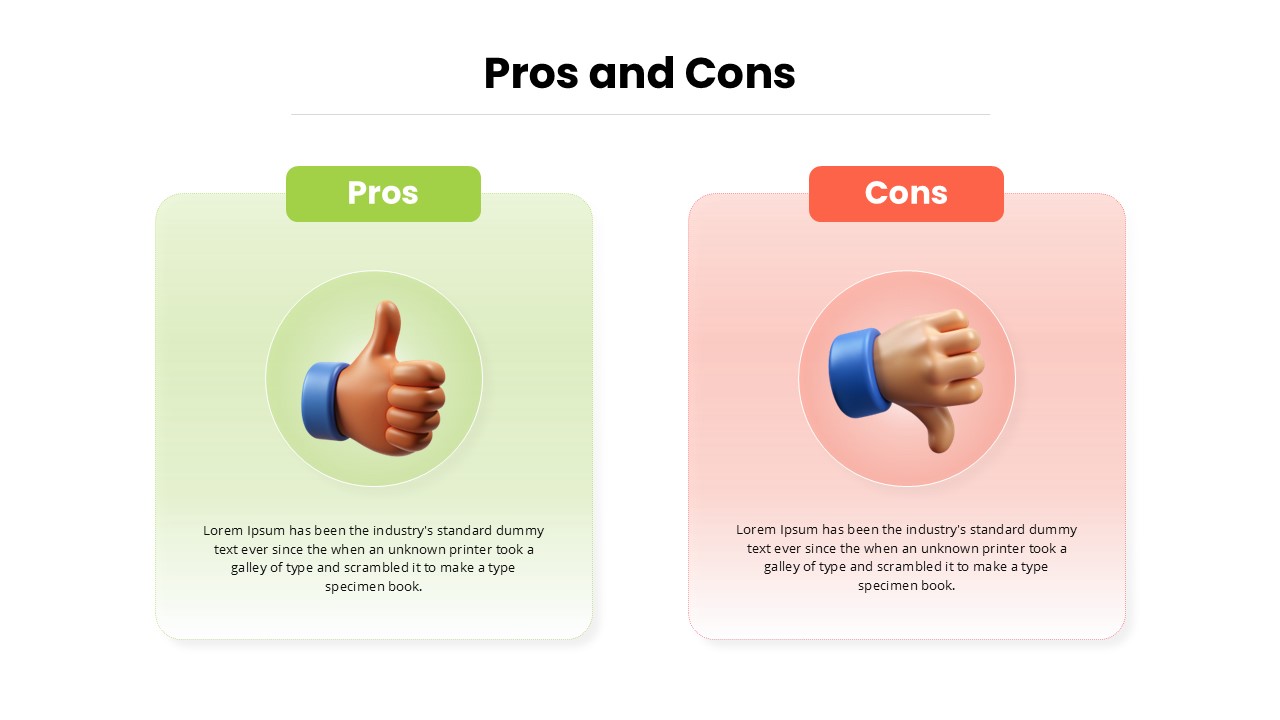
Leverage this versatile 4-slide pros and cons infographic pack to present balanced comparisons with impact. Each slide offers a distinct layout—arrow callouts with icons and percentages, radial central diagram with linked bullet lists, side-by-side 3D thumb graphics, and split-circle numbered pros/cons—allowing you to choose the best format for your content. All shapes, icons, and text fields are fully editable vector objects, so you can swap colors, icons, or typography with a few clicks. The clean white backgrounds and generous white space ensure your audience focuses on the comparison, while consistent use of vibrant green and red accents provides clear visual hierarchy. Master-slide support maintains formatting across your deck and speeds up updates.

Who is it for

Business analysts, project managers, consultants, and marketing teams will benefit from these infographics when evaluating product features, strategy trade-offs, risk assessments, or decision-making criteria.

Other Uses

Repurpose these slide designs for feature comparisons, SWOT overviews, cost-benefit analyses, stakeholder feedback summaries, or training evaluations by updating headlines, metrics, and icons to suit any context.

Login to download this file