


risk-scoring-ranking-dark-template-powerpoint-google-slides

Description
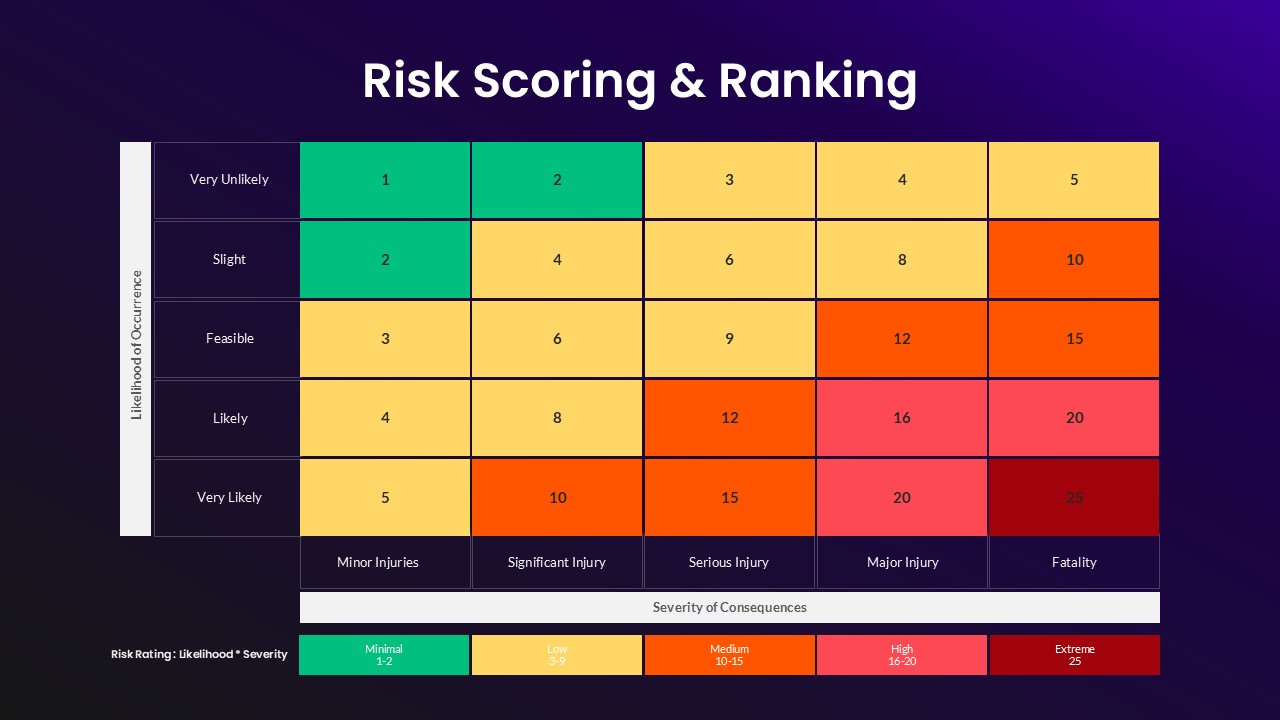
Visualize and quantify risk with this versatile Risk Scoring & Ranking Heatmap Matrix slide. The 5×5 grid maps Likelihood of Occurrence (Very Unlikely to Very Likely) against Severity of Consequences (Minor Injuries to Fatality), with each cell displaying a risk score (1–25) and color-coded from green through yellow and orange to deep red. A legend beneath the matrix decodes risk categories—Minimal (1–2), Low (3–9), Medium (10–15), High (16–20), and Extreme (25)—enabling stakeholders to instantly identify priority areas.
Built on master slides for both PowerPoint and Google Slides, this template features intuitive placeholders for editing row and column labels, updating risk values, and customizing color thresholds. The clean white backdrop, subtle gridlines, and consistent typography ensure clarity, while bold header fonts anchor your slide’s title. Simply drag bar endpoints to reflect new rating scales, swap severity descriptors, or adjust the color palette to match brand guidelines without manual realignment.
Ideal for risk assessments, audit reviews, safety briefings, or project-planning workshops, this heatmap matrix streamlines your presentation preparation. Use it to compare site hazards, evaluate compliance gaps, prioritize mitigation efforts, or track trending risks over time. Whether you’re reporting to executives, facilitating cross-functional risk workshops, or embedding in broader strategic decks, this slide delivers maximum impact with minimal effort.
Who is it for
Risk managers, safety officers, auditors, project managers, and compliance teams will benefit from this slide when assessing and communicating risk levels, prioritizing controls, or reporting risk heatmaps to stakeholders.
Other Uses
Repurpose this matrix for impact-vs-effort prioritization, vendor performance rankings, budget allocation heatmaps, or customer satisfaction rating grids. Adjust labels, values, and color schemes to suit any two-dimensional scoring framework.
Login to download this file

Item ID
SB05376