


talent-mapping-9-box-grid-template-powerpoint-google-slides
Description
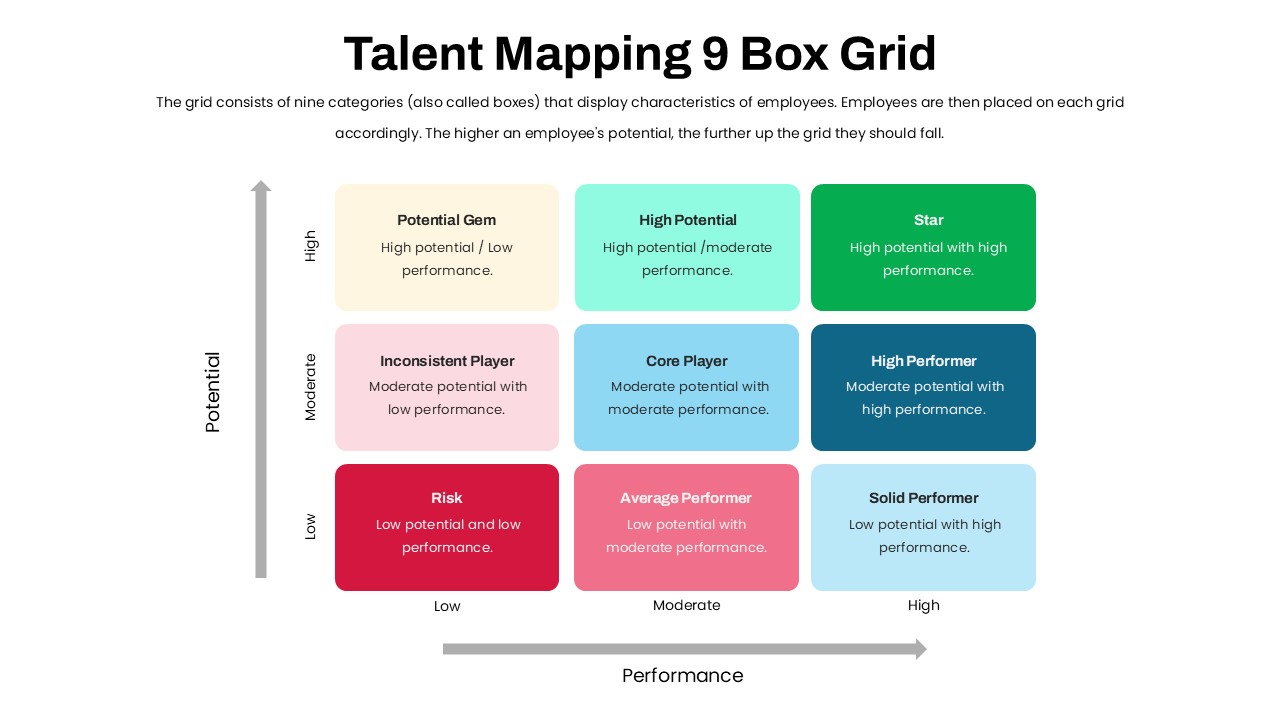
Visualize employee performance versus potential with this 9-box talent mapping grid. The layout features three rows (Low, Moderate, High Potential) intersecting three columns (Low, Moderate, High Performance), creating nine colored boxes—Risk, Inconsistent Player, Solid Performer, Average Performer, Core Player, High Performer, Potential Gem, High Potential, and Star. Each box includes a header and brief description, making it easy to categorize talent and identify development priorities. Editable axes and color-coded cells ensure clarity, while clean typography and ample white space maintain a professional aesthetic across presentations.
Built on master slides for both PowerPoint and Google Slides, this template allows one-click theme color swaps and global font updates. All elements are vector shapes for lossless scaling, and grouped connectors automatically realign when you reposition cells or text. Use entrance animations to reveal each row or column sequentially, guiding audiences through your talent assessment. Duplicate, hide, or relabel boxes to tailor the grid to four- or six-box models, or to reflect custom performance criteria. A subtle background grid and axis labels help stakeholders quickly interpret data, making this slide ideal for HR presentations, leadership offsites, and talent-review meetings.
Who is it for
HR leaders, talent management professionals, and organizational development specialists will leverage this grid to facilitate talent reviews, succession planning sessions, and performance calibration meetings.
Other Uses
Repurpose this matrix to map risk assessments, customer segments, product portfolios, or project prioritization frameworks. Simply relabel axes and cell headers to adapt the grid for any nine-category analysis.
Login to download this file

Item ID
SB05298