


traffic-cone-shapes-powerpoint-and-keynote-template1
Description
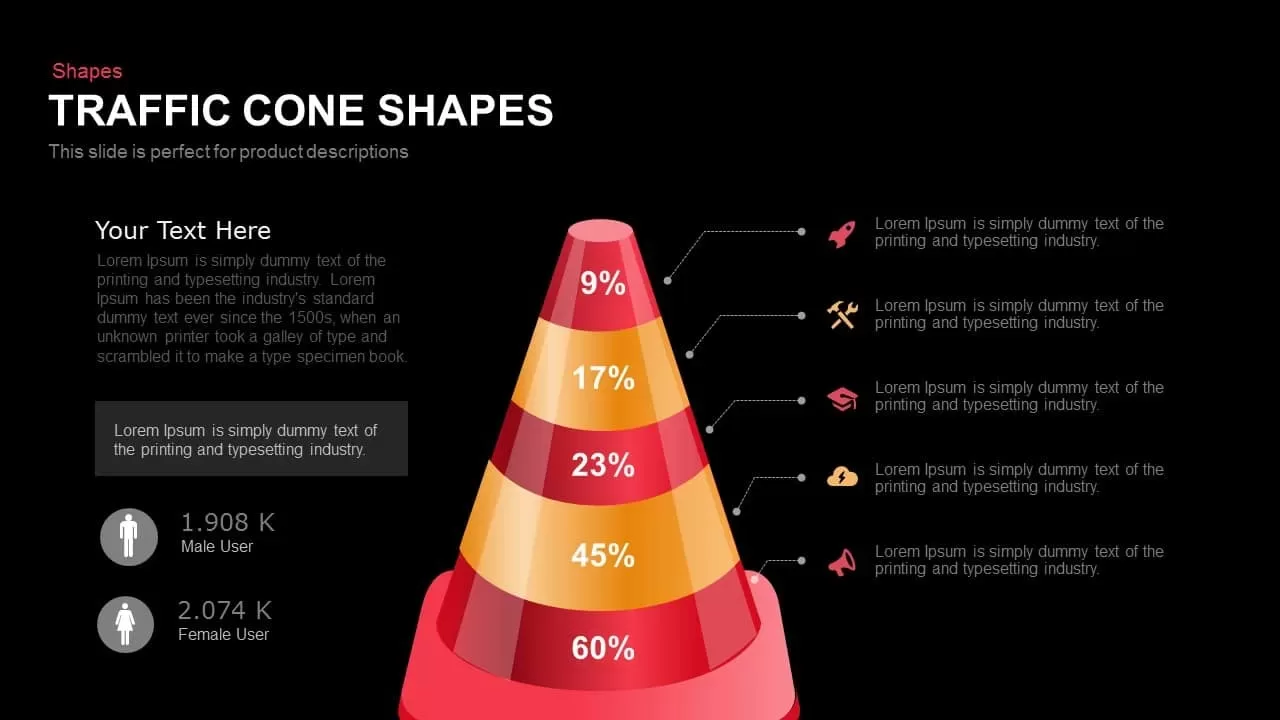
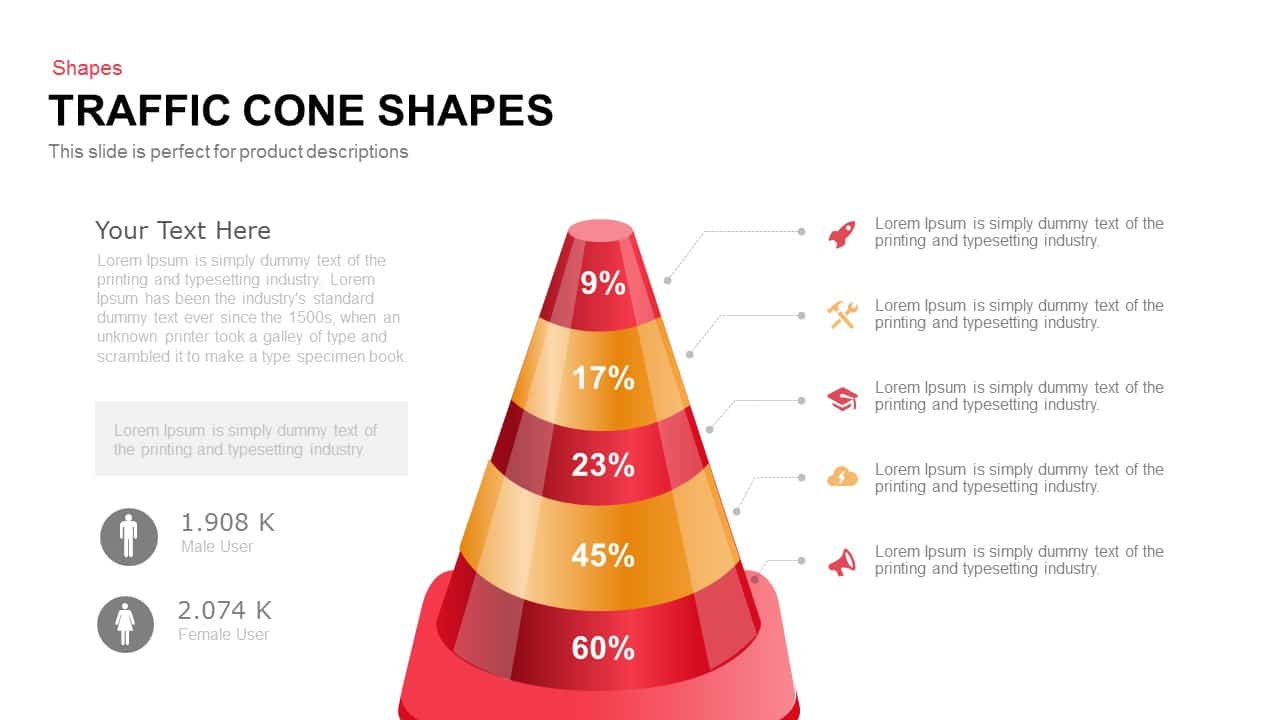
Leverage this Traffic Cone Funnel Diagram slide to visualize segmented data and process flows with a professional, engaging design. The layout centers on a three-dimensional cone graphic divided into five distinct tiers—deep red at the base, vivid orange and bright yellow gradients in successive bands, and mirrored accent hues—each displaying customizable percentage values. Fine connector lines elegantly link each band to editable text placeholders, allowing concise annotations or KPI highlights. To the left, a minimalist header area accommodates your title, subtitle, and supportive copy, while metric widgets below showcase two key statistics with intuitive icons and bold numerals. The cohesive color palette, subtle shadows, and crisp typography deliver modern flair while maintaining clarity across any presentation context.
Crafted as fully editable vector assets on master slides, this template enables instant customization: swap colors, adjust segment counts, edit data labels, and replace icons without distortion. Power users benefit from built-in chart objects and intuitive drag-and-drop controls, while preconfigured format painter and theme linking ensure consistent styling throughout your deck. Whether you’re working in PowerPoint or Google Slides, seamless transitions between devices and platforms preserve full-resolution fidelity, and optional animated entrance effects add dynamic impact during live presentations.
Versatile enough for strategic briefings, marketing reviews, and operational updates, this slide maintains consistency across industries—from finance and consulting to technology and education. Preconfigured for 16:9 aspect ratio and available in light and dark background variants, it includes guideline markers and safe-zone previews to streamline final edits. The cohesive design and robust formatting controls empower you to deliver data-driven insights with clarity and confidence.
Who is it for
Marketers, sales leaders, and business analysts will find this funnel diagram essential for presenting conversion rates, customer journey stages, and performance metrics. Project managers, consultants, and C-suite executives can leverage this slide to align stakeholders and drive data-driven strategies.
Other Uses
Beyond traditional funnel visualizations, this design can illustrate hierarchical breakdowns, priority rankings, risk assessments, product lifecycles, market segmentation, or phased project roadmaps. Adapt segment counts and labels to suit various content scenarios, from customer qualifying stages to resource allocation plans.
Login to download this file

Item ID
SB00510