


azerbaijan-map-powerpoint-and-keynote2
Description
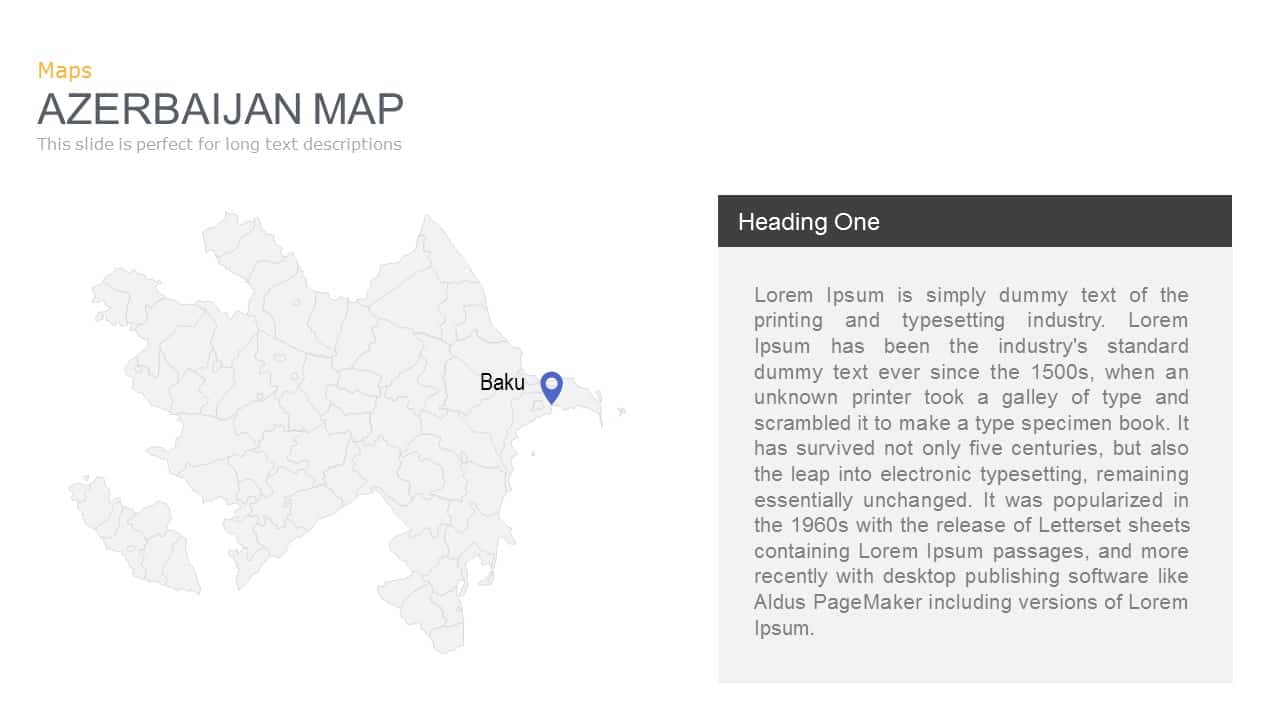
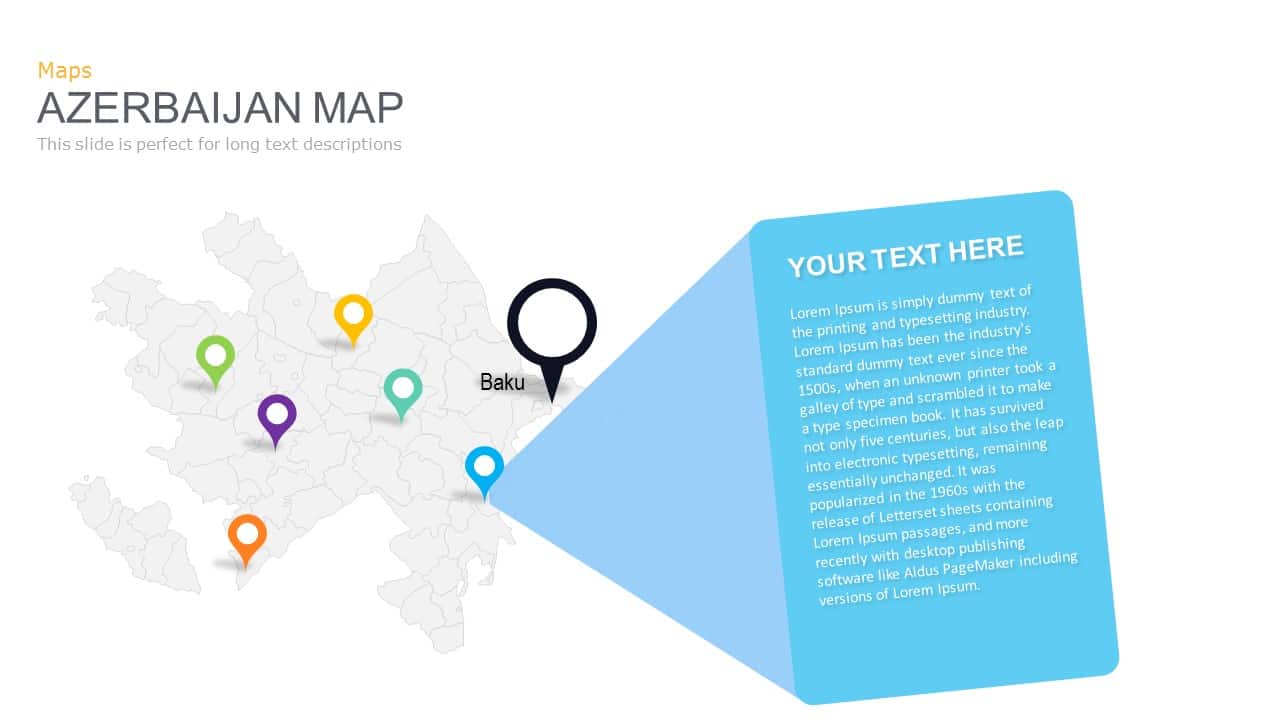
Leverage this detailed Azerbaijan map infographic to highlight regional insights and data points with pinpoint accuracy. On the left, a high-resolution grayscale vector map of Azerbaijan displays provincial boundaries, overlaid with vibrant location markers in green, yellow, purple, orange, and red. A bold black-ringed pin and flag icon call out Baku, instantly orienting your audience to the capital’s position.
Extending from the map, a large blue callout shape provides space for a headline and long-form text, ideal for explaining market analyses, demographic breakdowns, or strategic findings. Subtle connector lines link each marker to its province, ensuring visual clarity without clutter. Semi-transparent gradient arrows on the slide margins suggest guided, step-by-step navigation through your regional narrative.
Built on fully editable master slides, every element—map shading, marker hues, callout geometry, and typography—is vector-based for seamless customization. Swap marker colors to align with your branding, reposition pins to reflect evolving data, or adjust callout dimensions to accommodate additional commentary. The clean white background and modern font choices ensure optimal readability on both PowerPoint and Google Slides, while eliminating version-control headaches across platforms.
Whether you’re presenting market-entry strategies, sales-territory analyses, infrastructure plans, or educational lectures, this slide streamlines complex geographic data into a single, polished asset. Duplicate or remove pins to match your dataset, update text placeholders with key metrics or bulleted insights, and maintain professional consistency across your entire deck with minimal effort.
Who is it for
• Market researchers and sales managers mapping territory performance
• Logistics planners and supply-chain analysts visualizing distribution networks
• Government officials and consultants presenting demographic or infrastructure studies
• Academic instructors delivering geography or regional development lectures
Other Uses
• Travel-itinerary overviews highlighting key destinations
• Investment proposals showcasing project sites and regional opportunities
• Risk-assessment heat maps with custom marker icons
• Customer-distribution dashboards and stakeholder reporting
Login to download this file

Item ID
SB00491