curved-road-map-powerpoint-and-keynote-template

Description
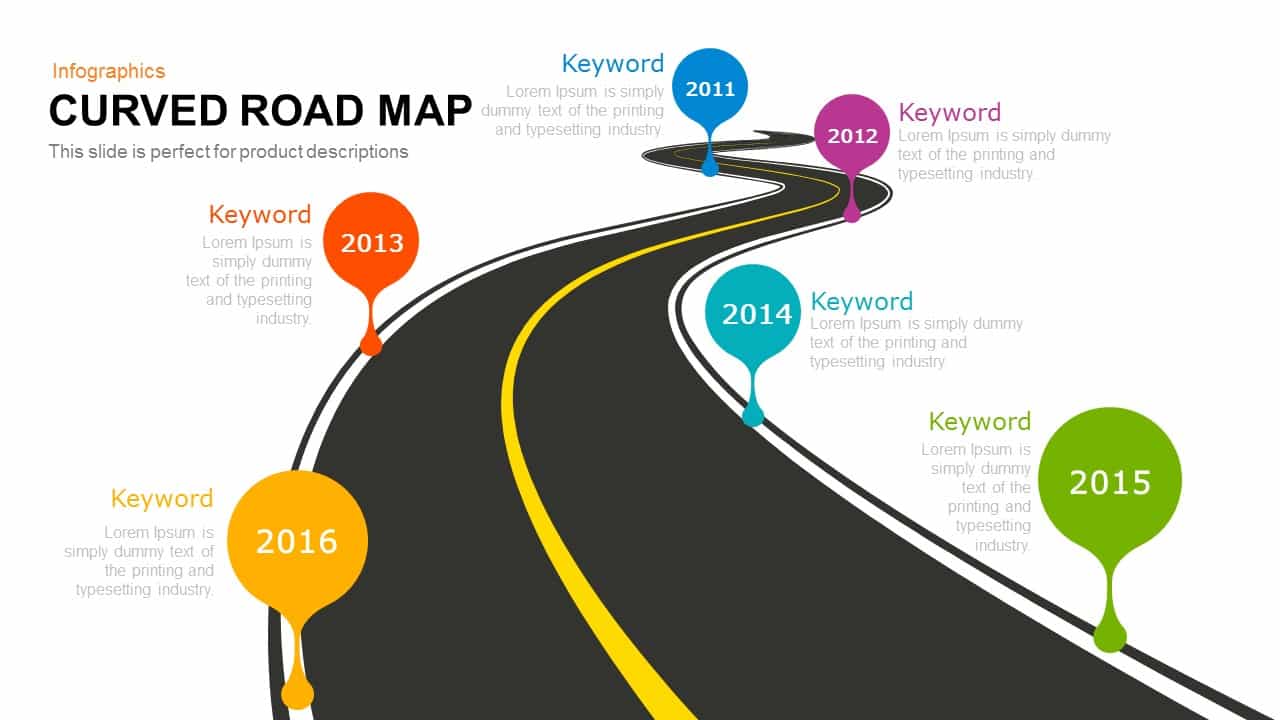
This slide features a dynamic curved road infographic rendered in high-resolution vector format, with a bold black asphalt path, bright yellow centerline, and clean white background. Five vividly colored milestone markers—blue (2013), magenta (2013), aqua (2014), green (2015), and orange (2016)—rise along the curve, each paired with a succinct heading placeholder. Dashed connector lines extend from each marker to text blocks for concise commentary, while subtle gradient arrows on the slide margins suggest a guided, step-by-step journey. Ideal for representing timelines, strategic roadmaps, or sequential processes, this layout guides viewers smoothly from start to finish.
Designed on fully editable master slides, every element—from the road curvature to the year labels and marker icons—is customizable with a few clicks. Adjust marker colors, modify year text, replace connector styles, or swap typography to align with your brand palette and presentation theme. Vector-based components ensure pixel-perfect scaling across PowerPoint and Google Slides, eliminating resolution issues. Ample white space and minimalist typography maintain clear readability, while the balanced composition supports both desktop and mobile viewing. This streamlined design accelerates slide creation and reduces formatting headaches.
Whether presenting project timelines, product launch schedules, marketing roadmaps, or strategic plans, this curved road infographic transforms complex sequences into an engaging visual narrative. Duplicate or remove milestone markers to suit varying project lengths, or repurpose the layout for lifecycle stages, sales funnels, or workshop agendas. The intuitive placeholder text areas let you add bullet points, brief descriptions, or summary metrics without cluttering the design. With seamless compatibility across platforms, this slide empowers presenters to deliver polished, professional stories that resonate.
Who is it for
Project managers, marketing strategists, product planners, and consultants will leverage this curved road map infographic to illustrate timelines, roadmaps, or sequential processes in stakeholder briefings, executive presentations, or training workshops.
Other Uses
Beyond project scheduling, repurpose this slide to visualize customer journey maps, lifecycle stages, onboarding flows, sales pipelines, or educational timelines. Adjust or duplicate markers to depict risk assessments, milestone tracking, or departmental rollouts across any context.
Login to download this file
Add to favorites
Add to collection


