


ETL PowerPoint Templates black

Description
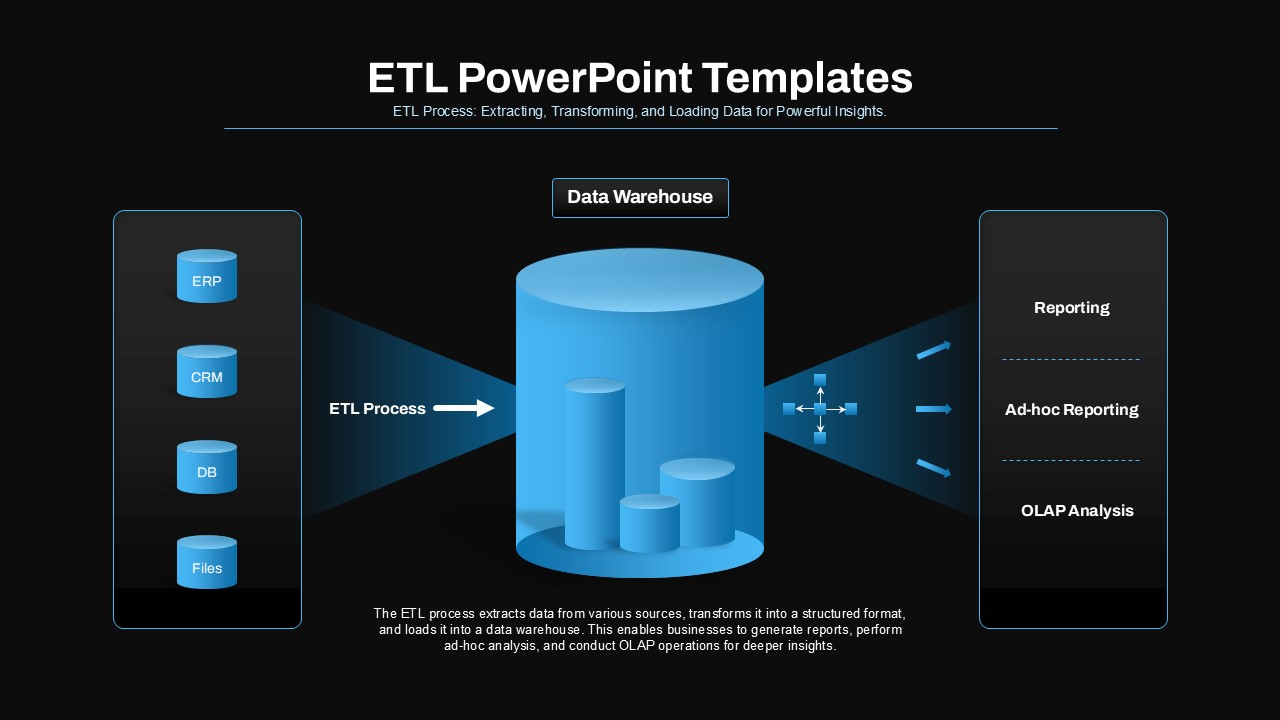
Leverage this detailed ETL data pipeline workflow diagram to visually map your extract-transform-load processes with precision and clarity. The slide features three primary stages—Extract, Transform, and Load—represented by customizable vector icons housed within color-coded containers. Sleek arrowed connectors guide viewers from data sources on the left through transformation logic in the center to target destinations on the right. Each stage includes a bold headline placeholder, a concise text block for describing tools or metrics, and optional data callouts for KPIs such as record counts or throughput rates.
Built entirely on master slides with scalable vector shapes, this template offers full control over every element: swap icons from the embedded 50+ symbol library, recolor containers via theme settings to match your corporate palette, adjust arrow styles, or modify typography without any loss of fidelity. Precision snap-to-grid alignment guides ensure perfect symmetry when duplicating or reordering stages, while optional drop shadows add subtle depth. Intuitive placeholders streamline content insertion, and the modular design supports the addition of pre- or post-processing steps if your pipeline extends beyond the core ETL phases.
Optimized for both PowerPoint and Google Slides, the slide maintains high-definition clarity across all devices and supports collaborative, cloud-based editing. Whether you’re presenting to data engineering teams, leadership stakeholders, or external partners, this ETL workflow diagram transforms complex integration architectures into an engaging, easy-to-follow visual narrative that drives alignment and accelerates decision-making.
Who is it for
Data engineers, BI developers, solution architects, analytics managers, and IT consultants will leverage this template when designing system overviews, migration plans, or reporting workflows in technical workshops and executive briefings.
Other Uses
Beyond classic ETL scenarios, repurpose this slide for data-quality dashboards, API integration maps, DevOps deployment pipelines, machine-learning preprocessing steps, or batch-processing schedules—simply update labels and icons to suit any data-centric workflow.
Login to download this file

Item ID
SB04751