


Quarterly Revenue Chart PowerPoint Templates black

Description
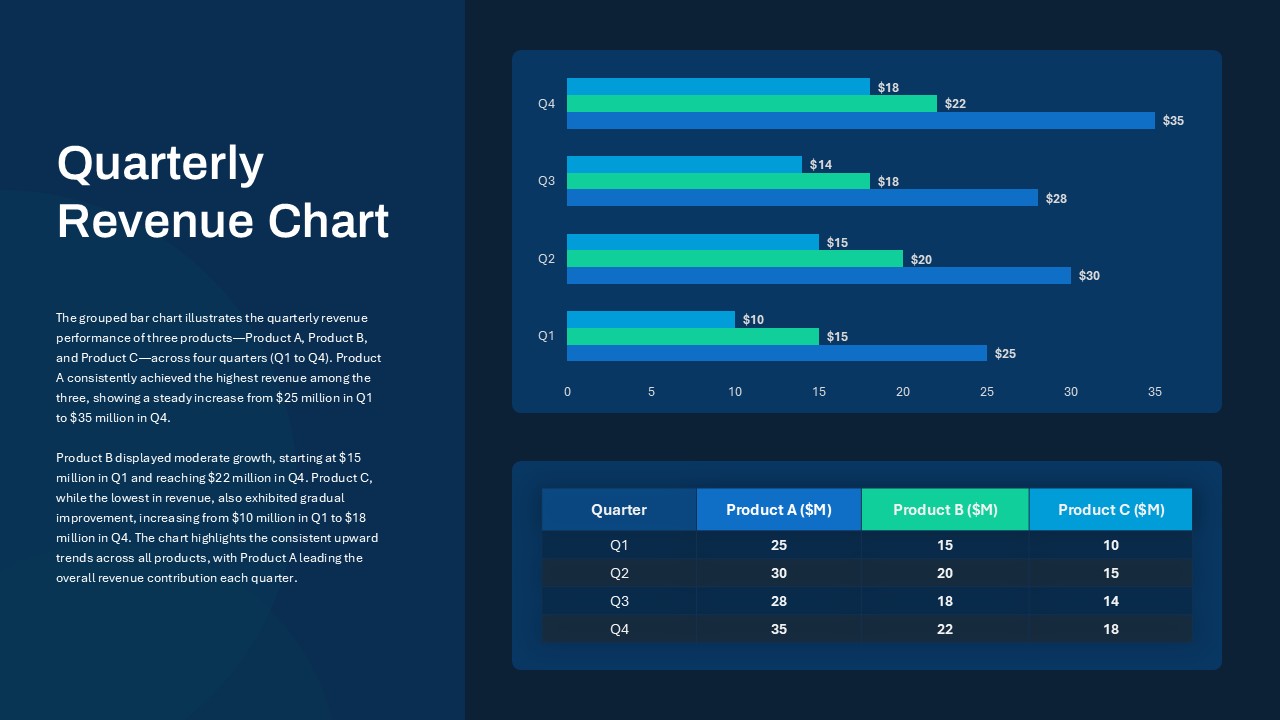
Leverage this dynamic grouped bar chart slide to present quarterly revenue performance for Product A, B, and C across four fiscal periods (Q1 to Q4). The chart features horizontally oriented bars in distinct hues—dark blue for Product A, teal for Product B, and cyan for Product C—enabling clear visual comparisons of revenue growth trajectories. Accompanied by a concise data table below, stakeholders can quickly scan numerical values while benefiting from the slide’s clean layout and consistent typography.
Designed for maximum usability, this template incorporates editable chart elements, master slide integration, and customizable color palettes. Swap in your own product names, adjust data values, and restyle fonts or backgrounds in seconds. Whether you’re preparing a quarterly business review, financial report, or executive briefing, this slide streamlines your workflow and ensures brand consistency across presentations.
Optimized for both PowerPoint and Google Slides, the slide maintains full-resolution clarity across platforms and devices, eliminating formatting hiccups and version-control issues. Its balanced composition—juxtaposing a bold title panel with a chart-and-table layout—ensures your audience remains focused on key performance indicators and revenue trends. Subtle drop shadows and modern flat design elements deliver a professional aesthetic that adapts effortlessly to corporate or startup branding.
Who is it for
This revenue chart slide is ideal for finance teams, business analysts, and product managers tasked with demonstrating sales performance and growth trends. Executives and board members will appreciate the clear visual articulation of quarterly results, while consultants and sales directors can leverage the format to showcase client performance metrics.
Other Uses
Beyond product revenue analysis, repurpose this template for budget tracking, expense comparisons, market share evaluations, or resource allocation reviews. The grouped bar chart layout also works effectively for academic research presentations, startup pitch decks, and investor updates requiring precise data visualization.
Login to download this file

Item ID
SB04314