


United States Map With Zoom View 1
Description
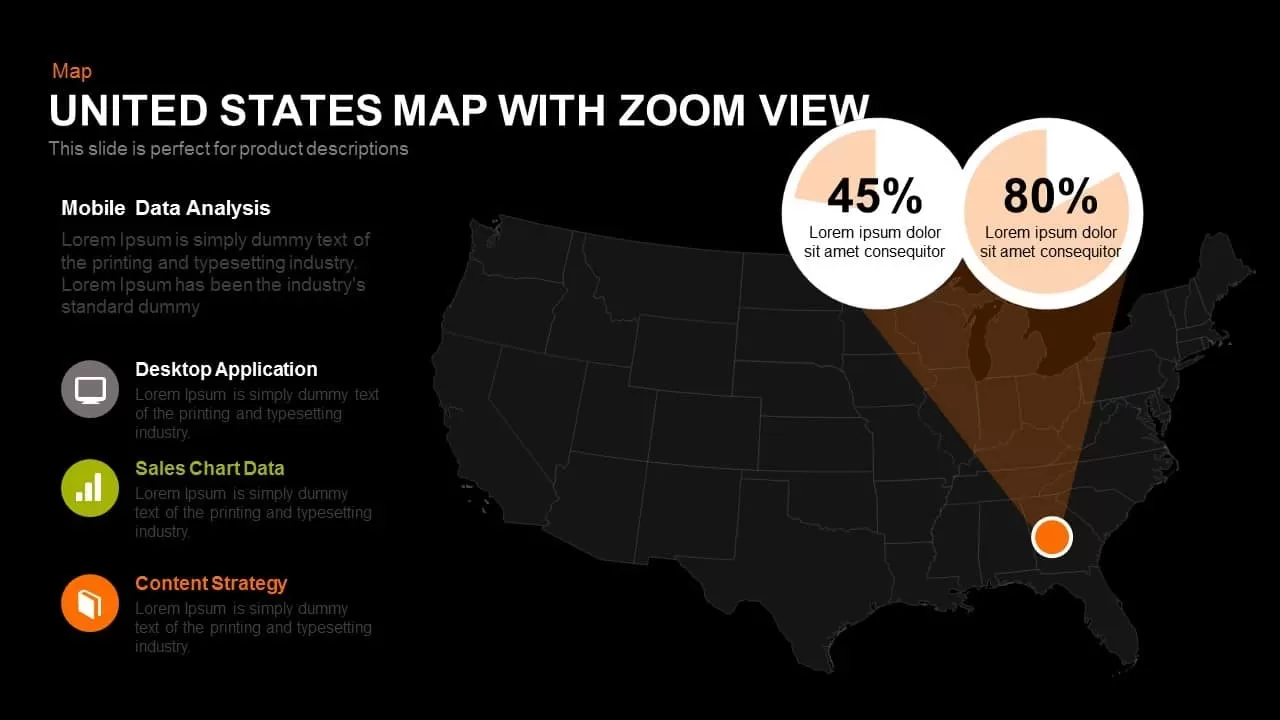
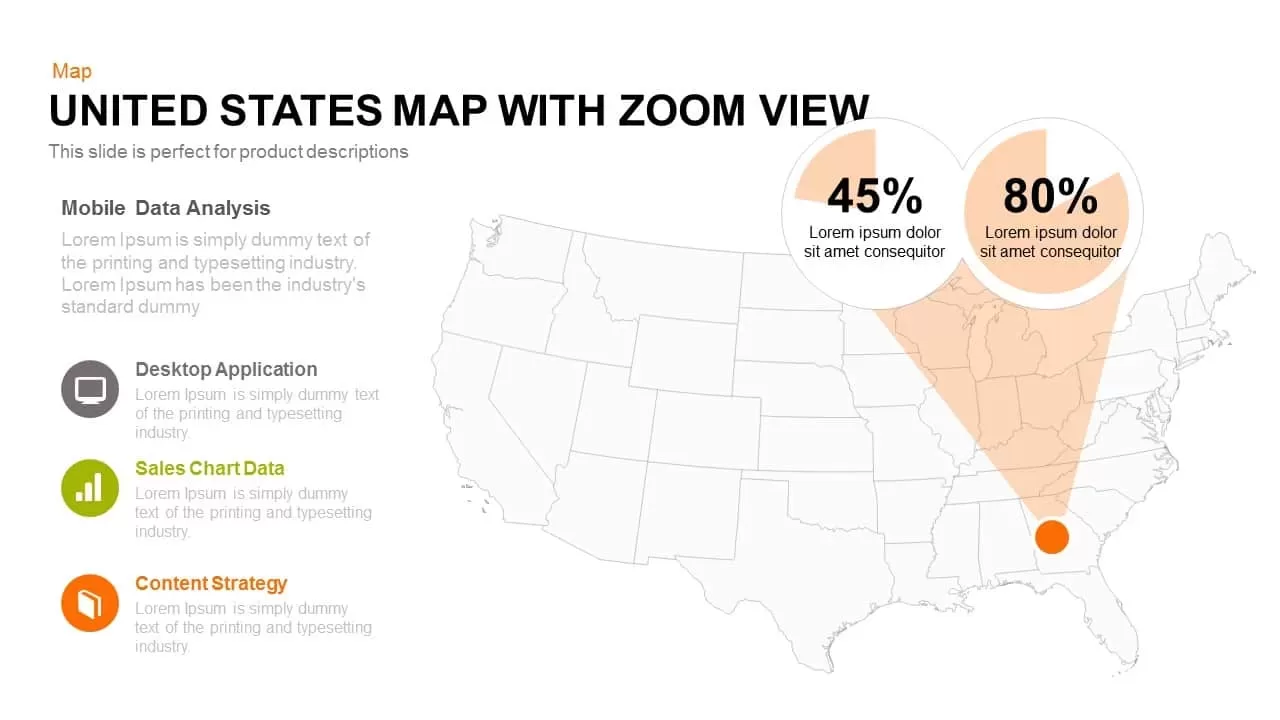
This slide showcases a map of the United States, designed to highlight specific areas of focus with a zoom feature, perfect for product descriptions and data analysis presentations. The map utilizes a clear, clean design with a transparent overlay that emphasizes key regions using orange-shaded areas. The data, represented by percentage figures (45% and 80%), allows you to add customized information, making this a flexible tool for illustrating data trends or geographic priorities. The map is an excellent asset for presentations involving mobile data analysis, desktop applications, sales chart data, and content strategy discussions.
The simple yet effective design makes it easy to integrate your own visuals and data, offering quick adjustments to fit your specific narrative. Whether used in corporate settings, strategy meetings, or educational presentations, this map template ensures your key points stand out visually. Optimized for both PowerPoint and Google Slides, this asset delivers smooth integration and high-resolution clarity, enhancing your professional presentations.
Who is it for
This slide is ideal for data analysts, business strategists, and marketing professionals who need to highlight key geographic regions or data points in their presentations. It’s also perfect for teams focused on mobile applications, desktop software, sales analysis, or content strategy, allowing for easy visualization of location-based data.
Other Uses
Besides its use for geographic or data analysis, this map slide can be repurposed for project status reports, sales performance evaluations, or market segmentation breakdowns. It is versatile enough for use in client reports, strategic discussions, and operational updates, helping teams clearly communicate regional focus or performance metrics.
Login to download this file
Add to favorites
Add to collection

Item ID
SB00389