


Product Ops PowerPoint Template
Description
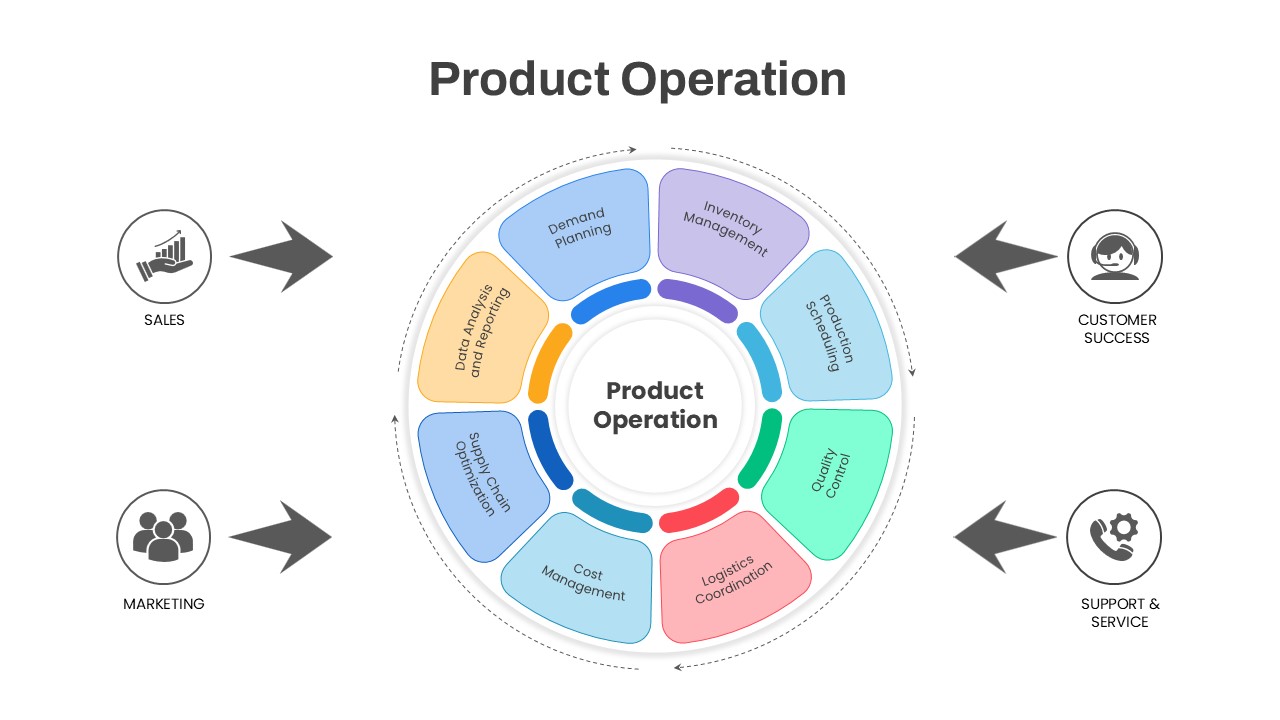
In the Product Operation Process Diagram slide, a central circular hub labeled “Product Operation” is surrounded by eight pastel-colored segments representing Demand Planning, Inventory Management, Production Scheduling, Quality Control, Logistics Coordination, Cost Management, Supply Chain Optimization, and Data Analysis & Reporting. A dashed outer arrow ring illustrates the continuous nature of product operations, while directional arrows connect four external departments—Sales, Marketing, Customer Success, and Support & Service—via simple monochrome icons. This clean, modern design features editable master shapes and text placeholders, enabling you to customize segment labels, adjust color palettes, and reposition icons with ease.
Built for clarity and impact, each segment uses distinct pastel hues to differentiate key operational functions, while the central hub maintains focus on core product processes. The grayscale department icons and arrows offer contrast and visual balance, guiding audience attention seamlessly between internal workflows and external stakeholders. Perfect for strategic planning, performance reviews, or training sessions, this slide enhances comprehension by visually mapping the interplay between product operations and business functions.
Optimized for both PowerPoint and Google Slides, this fully editable template preserves high-resolution fidelity across platforms. Simply swap icons, edit text, or tweak colors in seconds to align with your brand guidelines. Use built-in animation presets to animate each segment’s entry, adding dynamic transitions for presentations. Its modular structure supports data-driven presentations by integrating KPI metrics or performance dashboards directly into the eight operational segments. Use color-coded highlights to emphasize priority areas and progress status at a glance. Whether you’re briefing executive teams, pitching to investors, or leading workshops, this diagram delivers a polished, professional look that makes complex processes accessible.
Who is it for
Operations managers, supply chain directors, product leaders, and business analysts will benefit from this diagram when illustrating end-to-end product workflows. Project managers and consulting teams can leverage the clear, cyclical layout to align stakeholders and drive data-informed discussions.
Other Uses
Beyond product operations, repurpose this slide for continuous improvement initiatives, quality assurance reviews, logistics strategy sessions, procurement planning, or cross-functional workshop materials. The versatile design adapts to marketing funnels, service delivery processes, or performance tracking dashboards.
Login to download this file
Add to favorites
Add to collection

Item ID
SB04477