


Risk Levels Presentation Slide

Description
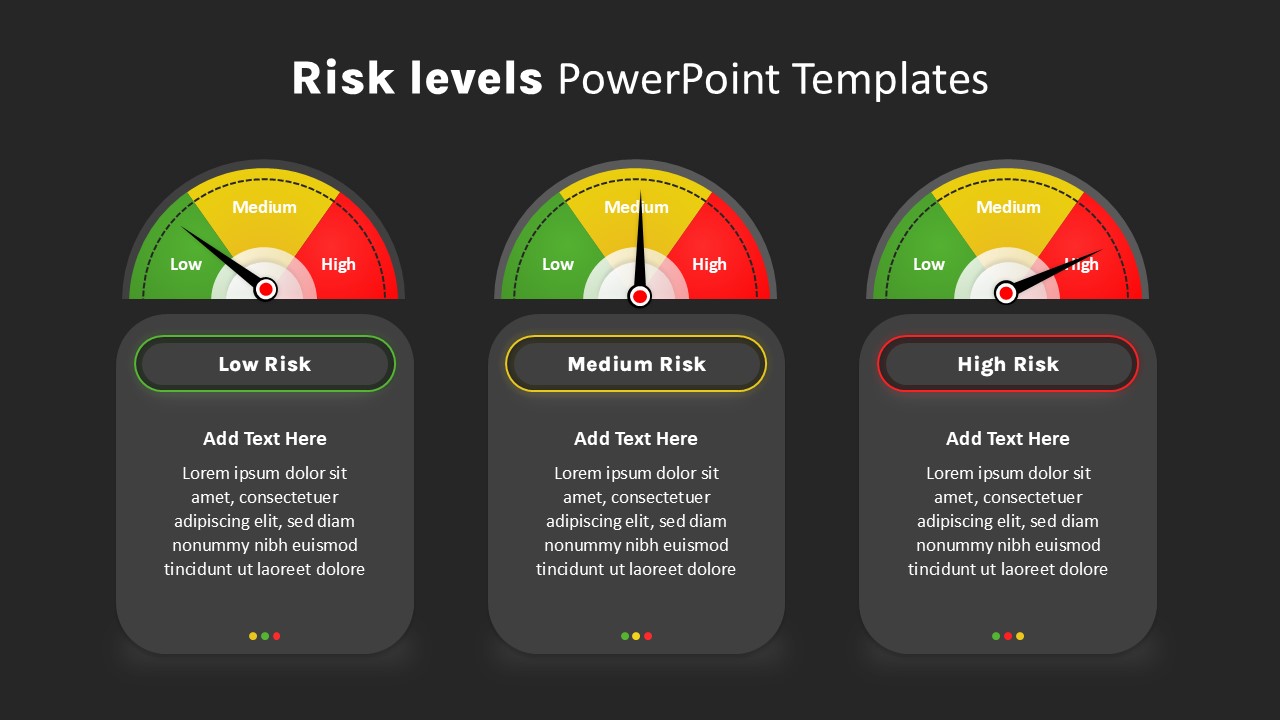
Leverage this three-tier risk level gauge comparison slide to visually communicate varying degrees of risk—low, medium, and high—across project, financial, or operational scenarios. Each semicircular meter employs vivid, color-coded segments (green for low, yellow for medium, red for high) complemented by a sleek needle indicator that immediately draws attention to the current risk status. Beneath the gauges, spacious text panels allow you to add context, analysis, or guidance. The unified three-column structure and minimalist styling ensure that complex information remains clear, focused, and easily digestible. Clear labels and intuitive icons amplify understanding, while optional animation presets enhance engagement on digital platforms.
Engineered on master slides for both PowerPoint and Google Slides, this template grants total design flexibility. Use built-in animation triggers or morph transitions to smoothly reveal each gauge during live presentations. Effortlessly adjust the gauge segments, swap icons, and modify colors to align with your brand palette. Text placeholders are optimized for concise messaging, while uniform margins and guides maintain a balanced, professional look. Whether you’re detailing risk mitigation strategies, summarizing compliance reviews, or comparing alternative options, you can customize every element in seconds without affecting slide integrity.
Streamline collaboration and version control with seamless editing capabilities. Duplicate the slide to compare different scenarios, update thresholds to reflect evolving data points, or integrate it into larger pitch decks and reports. This versatile layout is equally effective for single-slide executive summaries or as part of a comprehensive risk management presentation. Its streamlined layout also reduces cognitive load, enabling audiences to focus on key metrics and recommended actions without distraction. With consistent formatting across devices, you can confidently engage stakeholders and drive actionable insights without design distractions.
Who is it for
Project managers, risk analysts, compliance officers, and financial consultants seeking to illustrate varying risk levels in stakeholder presentations.
Other Uses
Beyond risk communication, repurpose this gauge-driven format to visualize KPIs in dashboards, monitor project progress, assess quality metrics, or showcase performance levels in sales and operations.
Login to download this file
Add to favorites
Add to collection

Item ID
SB04741