


Cost Structure PowerPoint Template
Description
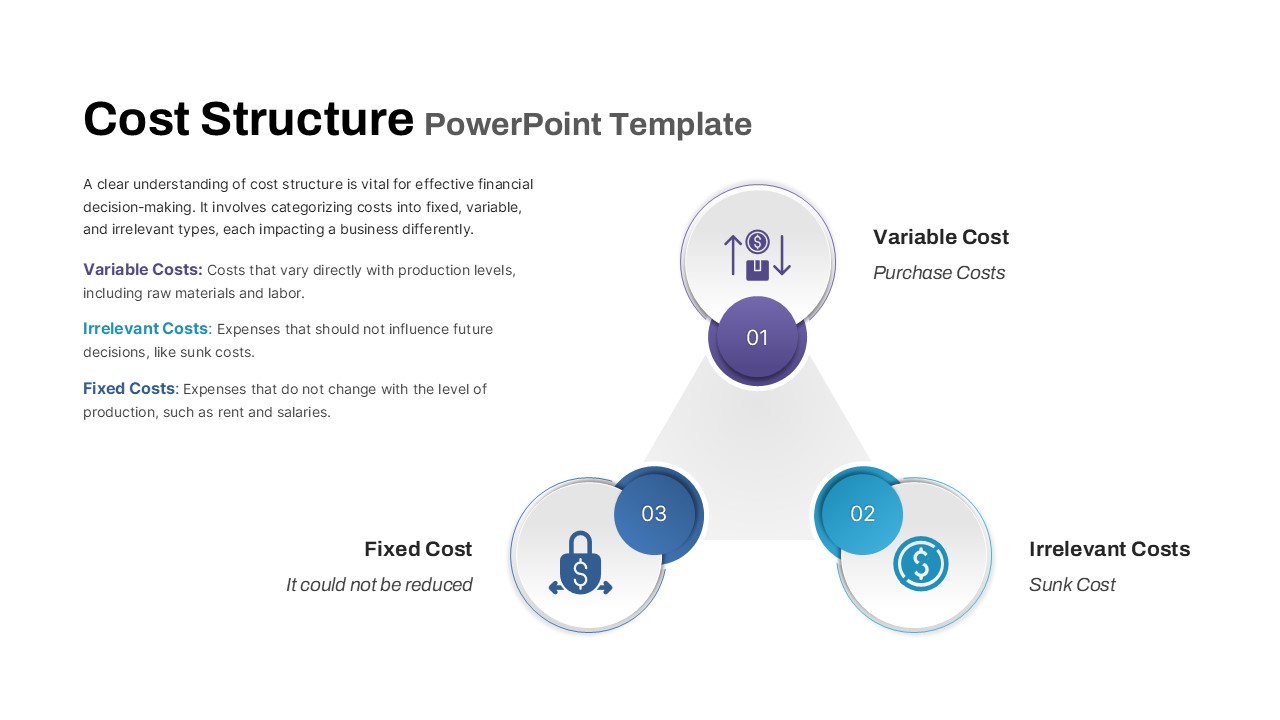
Elevate your cost analysis with this sleek, fully editable cost structure diagram designed for PowerPoint and Google Slides. The slide showcases a triangular layout with three prominent circular hubs, each representing a key cost category: Variable Costs (depicted by an up-down arrow with a dollar sign), Irrelevant Costs (denoted by a sunk cost icon), and Fixed Costs (illustrated by a dollar-padlock symbol). Soft gray outer rings and dashed line accents add subtle depth, while vibrant purple, teal, and blue fill colors draw attention to each node against a minimalist white background. High-contrast typography ensures readability, and balanced spacing maintains visual harmony. Subtle drop shadows beneath each node enhance the dimensional effect and guide viewers’ eyes through the sequence.
Leveraging master slides and intuitive placeholders, this template lets you effortlessly customize labels, icons, and color palettes to match corporate branding. Resize or reposition circles, adjust connector lines, or swap graphics with a few clicks—all without disrupting the overall composition. The triangular formation encourages quick comparisons, helping teams contrast cost behaviors and assess budgetary impacts with precision. Whether you need to rename segments, change shapes to squares or hexagons, or recolor outlines for thematic consistency, this slide adapts to your workflow.
Perfect for finance managers, business consultants, project leaders, and educators, this asset enhances budget reviews, strategic planning sessions, and cost optimization workshops. It also serves as a versatile tool for board presentations, investor pitches, and training modules, where clear categorization drives stakeholder alignment. Need more categories? Duplicate nodes or hide segments to transform the diagram into a two-, three-, or four-part analysis. Optimized for seamless display across screens, projectors, and printable handouts, this cost structure slide streamlines your presentation process while maximizing engagement and comprehension.
Who is it for
Finance managers, business consultants, project leaders, and educators will benefit from this cost structure diagram to illustrate and compare expense categories during budget reviews, training sessions, or strategic workshops.
Other Uses
Beyond cost analysis, repurpose this diagram for project status snapshots, risk assessments, resource allocation planning, vendor negotiations, profit margin breakdowns, or process overviews. Duplicate or hide circles to adapt for two-, three-, or four-step frameworks in board meetings, investor decks, or training manuals.
Login to download this file

Item ID
SB04462