


Value Engineering PowerPoint Flowchart Template
Description
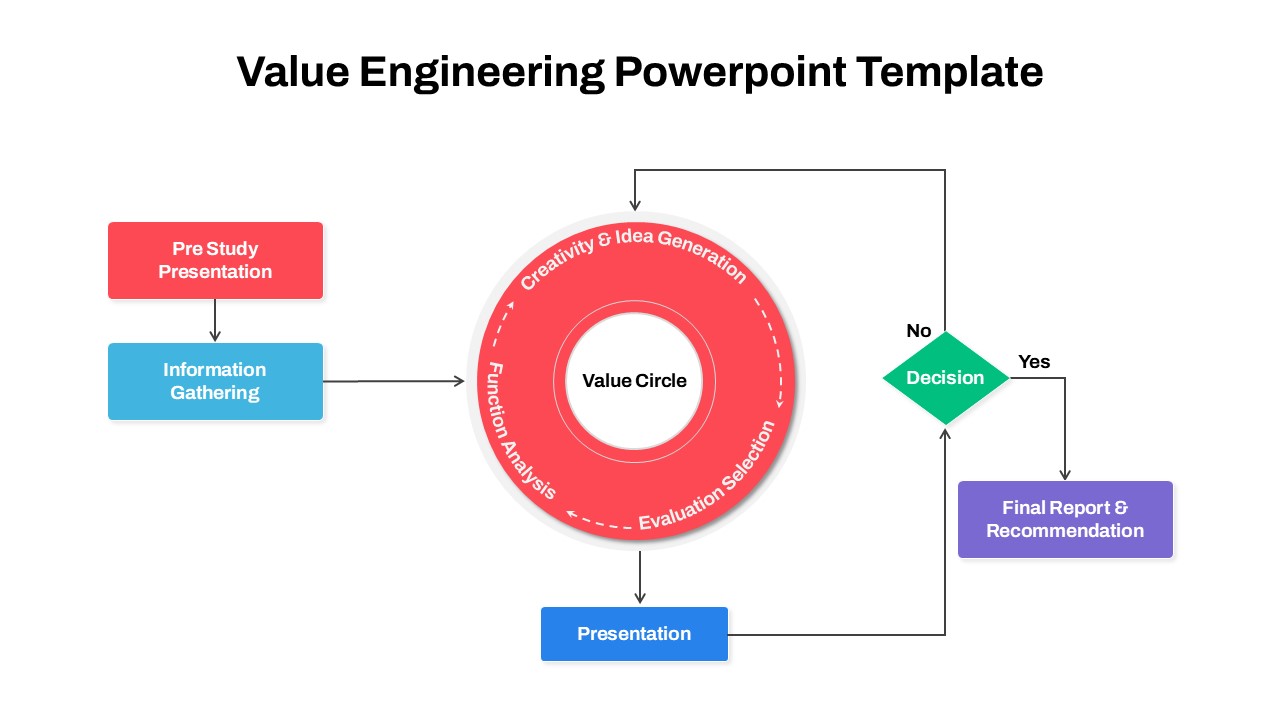
This slide offers a structured value engineering workflow diagram, combining linear and circular flows to visualize the complete study process. On the left, two colored rectangles—“Pre Study Presentation” (red) and “Information Gathering” (light blue)—are linked by arrows to the central Value Circle. The Value Circle consists of a bold red outer ring segmented into three phases: Creativity & Idea Generation, Evaluation & Selection, and Function Analysis. A white inner circle labels “Value Circle,” reinforcing core methodology. From the circle, an arrow leads to the “Presentation” (blue) stage at the bottom. To the right, a green decision diamond labeled “Decision” directs flow: a “Yes” path to the “Final Report & Recommendation” (purple) and a “No” loop back to the Value Circle, illustrating iterative refinement.
All components are editable PowerPoint vector shapes bound to master slides and theme color palettes. Text placeholders accommodate custom labels, while connector lines feature adjustable stroke weights and arrowhead styles. The slide uses clean sans-serif fonts, consistent alignments, and generous white space to enhance readability. Prebuilt grid guides and snap-to layouts ensure precise element placement. Users can quickly customize colors, adjust circle segment labels, or replace arrow connectors to match corporate branding. The design supports high-resolution export for large displays and print. Available for both PowerPoint and Google Slides, it maintains formatting fidelity across platforms and aspect ratios. Slide notes and animation presets are included for streamlined presentation delivery.
Who is it for
Process engineers, project managers, and industrial designers will leverage this slide to present value engineering studies, optimization strategies, and refinement cycles. Consultants, technical trainers, and R&D teams can use it to teach methodology and track iterative improvements.
Other Uses
Beyond value engineering, repurpose this slide to map design thinking cycles, continuous improvement loops, quality audits, or product development workflows. Update segment labels to illustrate DMAIC stages, innovation pipelines, or decision-making frameworks.
Login to download this file
Add to favorites
Add to collection

Item ID
SB04686