


Value Stream Infographic PowerPoint Template featured image
Description
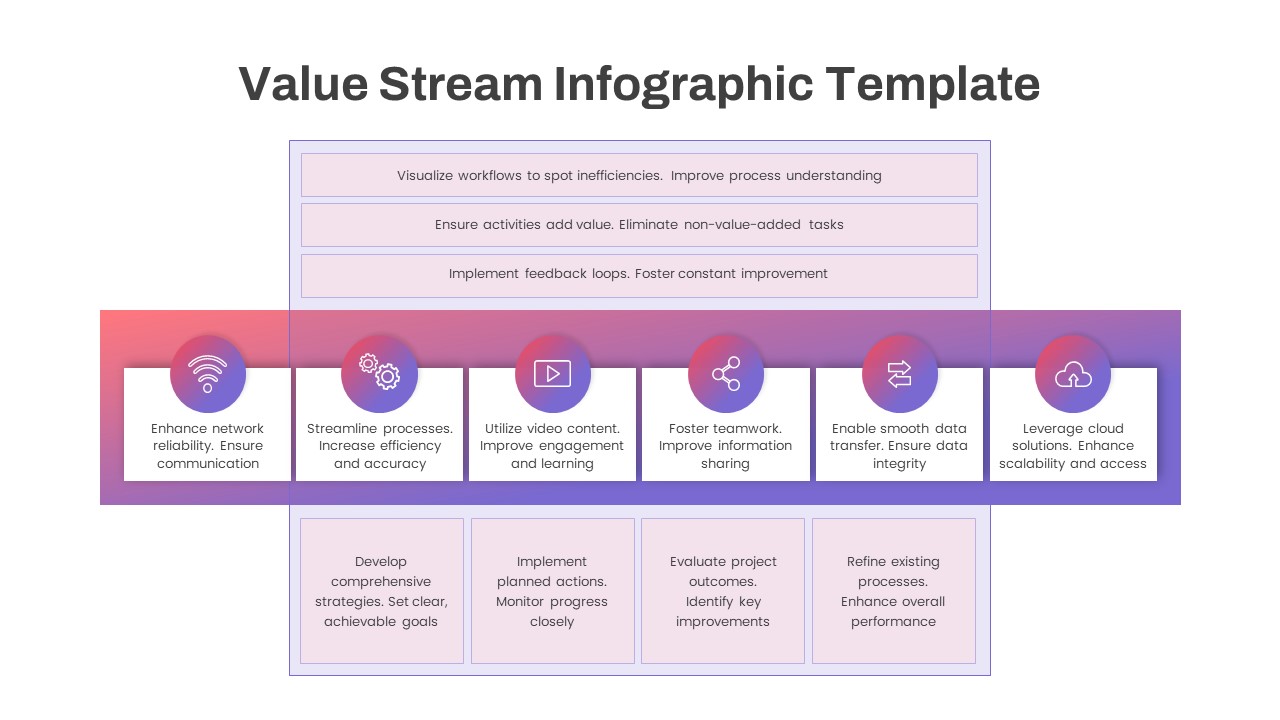
Leverage this visually engaging Value Stream infographic slide to map end-to-end workflows, eliminate non-value-added activities, and foster continuous improvement across teams and processes. The design employs a clear three-tier layout: the top section presents three principle boxes for visualizing workflows, ensuring value-adding tasks, and implementing feedback loops; a central gradient bar showcases six core value-add steps with distinct circular icons—network reliability, process automation, video-enabled learning, teamwork facilitation, data integrity, and cloud scalability; and the bottom section outlines a four-phase action plan to develop strategies, execute tasks, evaluate outcomes, and refine processes. A directional arrow spanning the footer reinforces forward momentum and connects each phase in a cohesive flow.
Each icon is set against a vibrant coral-to-purple-to-blue gradient background, while crisp white text cards with subtle drop shadows maintain readability and visual consistency. The modern typography, generous whitespace, and balanced alignment emphasize clarity, making complex information instantly digestible. Color accents and icon placeholders are fully customizable, enabling you to swap graphics, adjust hues, or reorder elements to match corporate branding.
Built on master slides for both PowerPoint and Google Slides, this template supports rapid customization: update text placeholders, modify color themes, and replace vector icons in seconds without disrupting the layout. Its high-resolution vector assets ensure sharp output across devices, while the intuitive structure simplifies stakeholder alignment and data-driven discussions.
Ideal for presentations on operational efficiency, Lean management, digital transformation, or project optimization, this slide helps you communicate process improvements and strategic roadmaps with precision and impact. Leverage this versatile template to engage stakeholders, drive decision-making, and track continuous improvement initiatives throughout your organization.
Who is it for
Operations managers, Lean consultants, and process improvement teams can use this slide to present value stream analyses and streamline workflows. IT leaders, project managers, and C-suite executives will find it useful for aligning stakeholders on digital transformation and continuous improvement strategies.
Other Uses
Beyond value stream mapping, repurpose this slide to outline process roadmaps, showcase operational KPIs, or illustrate Lean Six Sigma initiatives. Use the three-tiered layout to compare alternative workflows, vendor evaluations, or training modules in boardroom presentations or strategic workshops.
Login to download this file
Add to favorites
Add to collection

Item ID
SB04427