


Free 3d pie chart powerpoint template featured image
Description
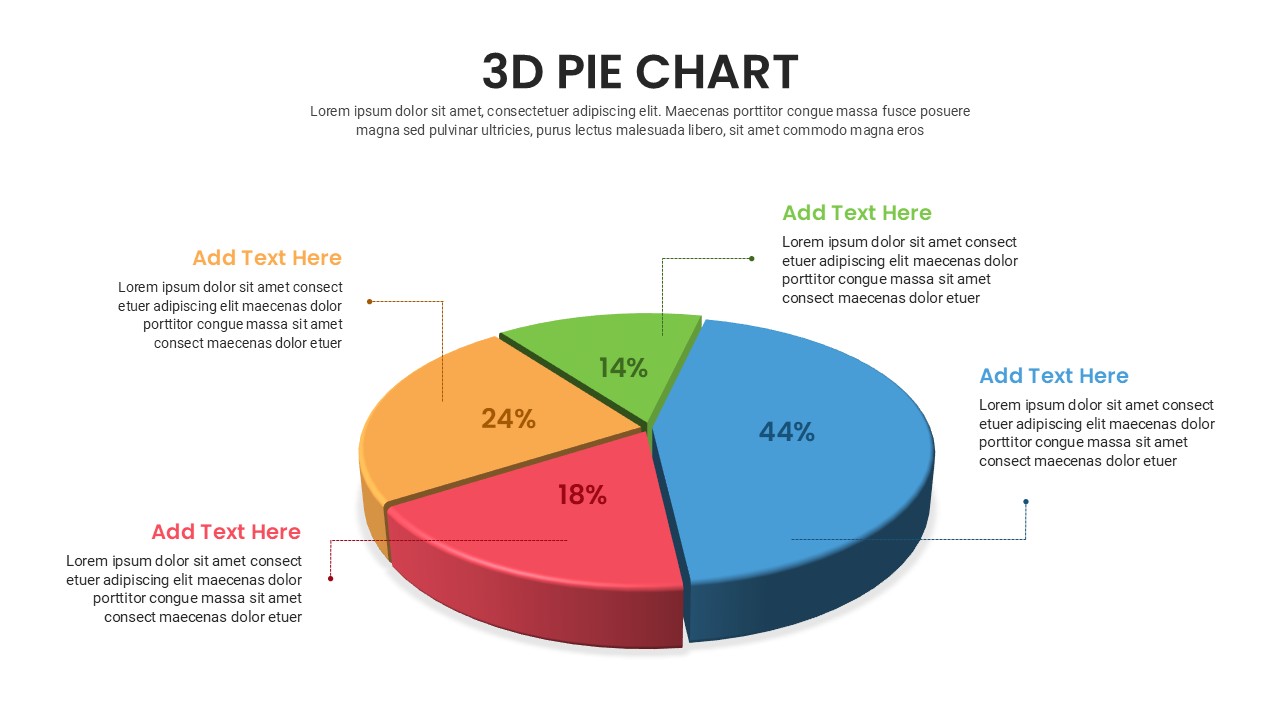
This 3D Pie Chart slide is an ideal tool for visually presenting proportional data in a dynamic and engaging way. It features four segments, each color-coded (blue, green, orange, and red) to represent different categories or data points, with their respective percentages (44%, 24%, 18%, 14%). The three-dimensional effect adds depth to the chart, making it stand out and capture the audience's attention.
Each section of the pie chart includes space for custom text, allowing you to easily explain the data or trends represented by the chart. This slide is perfect for reporting on survey results, financial distributions, or any other data-driven presentation. Its clean, modern design ensures that the focus remains on the information, while the vibrant colors help differentiate each segment clearly.
The slide is fully customizable, so you can adapt it to fit your own data needs. Whether for business presentations, marketing reports, or educational purposes, this 3D pie chart provides a visually appealing and professional way to present data.
Who is it for
This slide is ideal for business analysts, marketers, financial analysts, educators, and anyone needing to present data in a clear, visual format. It's also suitable for teams or individuals reporting on performance metrics, survey results, or financial allocations.
Other Uses
In addition to general data analysis, this slide can be repurposed for showing market share breakdowns, demographic data, project budget distribution, or any other scenario that requires displaying percentages in a visually appealing way. Its flexible design makes it useful across various industries and presentation contexts.
Login to download this file

Item ID
SBF00004