


Balanced Scorecard PowerPoint Template circles slide
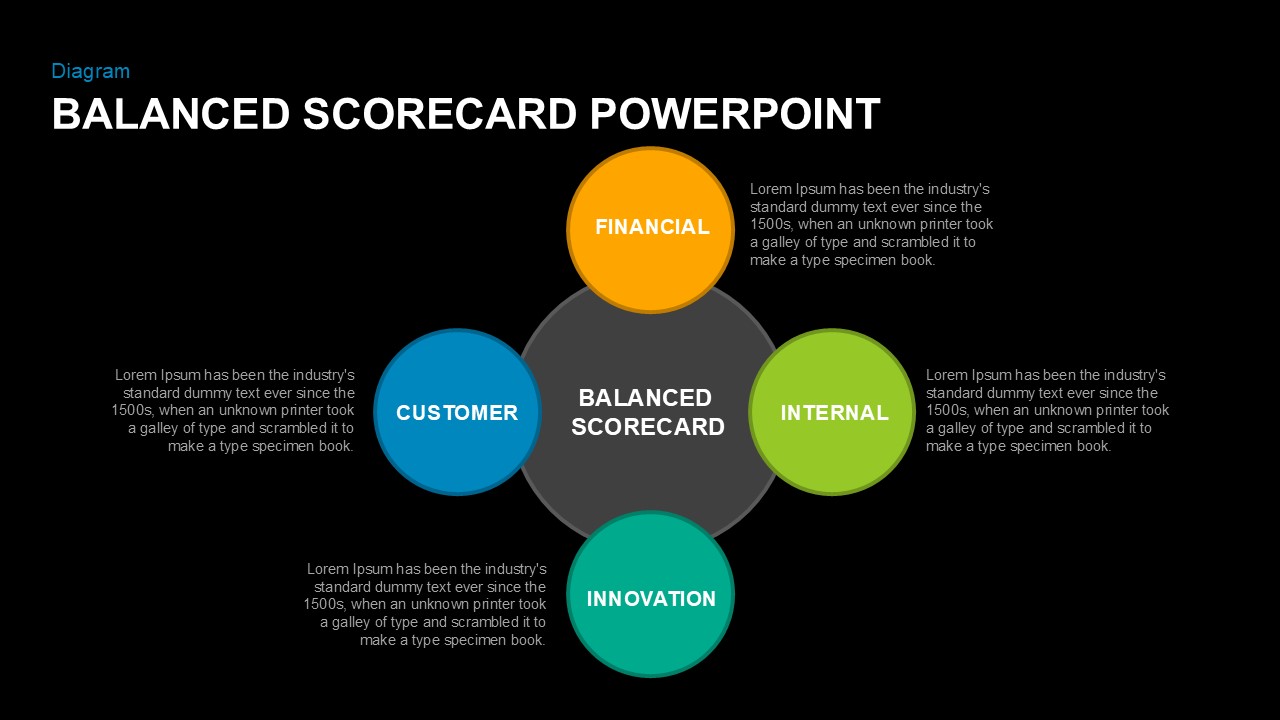
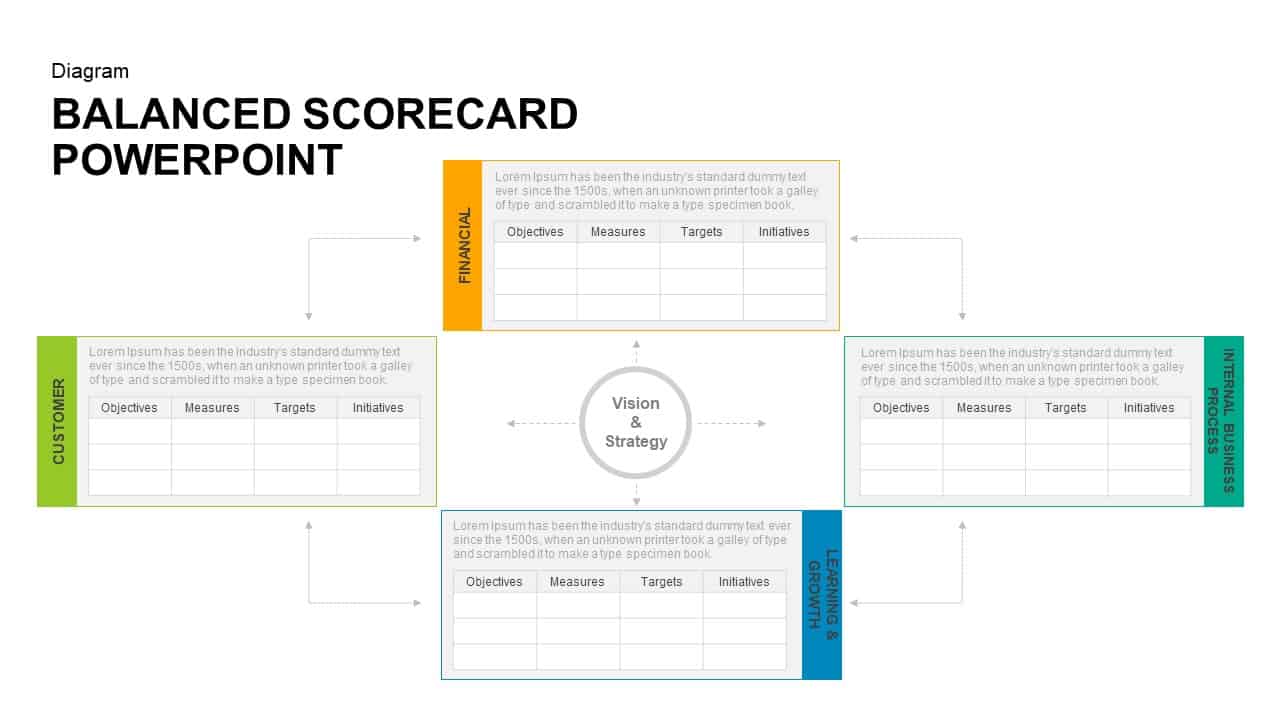
This Balanced Scorecard Diagram slide provides a comprehensive and structured approach to measuring business performance across multiple perspectives. It is designed to help businesses align their objectives, strategies, and key performance indicators (KPIs) across four critical areas: Financial, Customer, Internal Processes, and Learning & Growth. With clearly defined sections and placeholders, this diagram makes it easy to track and communicate performance goals and results.
The first slide offers a traditional four-quadrant format, each dedicated to a specific perspective of the Balanced Scorecard. The second design presents a circular layout, with each quadrant connected to the central "Balanced Scorecard" hub, emphasizing the interconnectedness of each area. The third layout features a more detailed approach, highlighting individual elements within each perspective and how they contribute to overall strategic goals. Lastly, the fourth slide presents a detailed strategy map for achieving shareholder value through targeted strategies and KPIs, creating a roadmap for business success.
These slides can be customized with your own text, objectives, and KPIs, allowing for flexibility across industries. Whether you're discussing strategic management, corporate performance, or organizational growth, this Balanced Scorecard diagram helps communicate complex data in a visually compelling and easily digestible format.
Who is it for:
This diagram is ideal for senior managers, business analysts, strategy consultants, and executives who need to track and communicate business performance. It's also perfect for corporate teams engaged in strategic planning, performance measurement, and process improvement.
Other Uses:
In addition to traditional Balanced Scorecard use, this diagram can be adapted for strategic business analysis, marketing performance tracking, and organizational development. It’s versatile for industries such as finance, healthcare, education, and manufacturing, where performance metrics are key to success.
Login to download this file
Add to favorites
Add to collection

Item ID
SB01007