


Radial Bar Chart Template Powerpoint and Keynote template 1
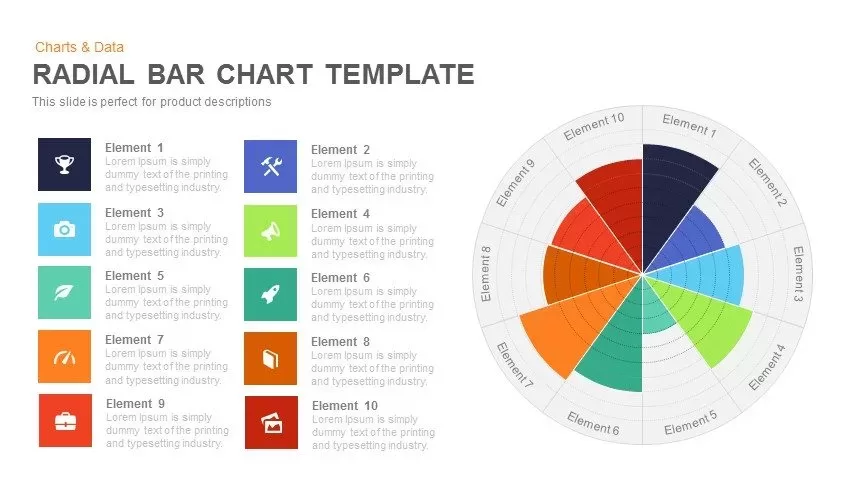

Unlock clear visual storytelling with this colorful radial bar chart slide designed to showcase up to ten discrete data points in a single circular diagram. Each segment extends outward from the center, using a spectrum of vibrant hues and numbered labels to convey differences in magnitude at a glance. The accompanying icon legend pairs each radial bar with a customizable icon—ranging from trophies and tools to leaves and packages—enabling you to contextualize metrics such as performance indicators, project milestones, or product features with intuitive imagery.
Built on fully editable masters, this slide empowers you to adjust segment values, swap vector icons, or redefine color schemes in seconds. The clean white background and modern flat design ensure maximum focus on your data, while subtle radial gridlines guide the eye. Automatic alignment and equal spacing between bars preserve visual balance whether you display fewer or all ten metrics. Perfect for dashboards, executive summaries, and KPI presentations, this radial bar chart seamlessly adapts to research reports, product overviews, marketing reviews, or financial analyses.
Optimized for both PowerPoint and Google Slides, the slide maintains crisp vector elements and legible typography across screen sizes. Leverage placeholders to insert descriptions, adapt icons, and embed legends without manual resizing. Whether you’re presenting quarterly goals, comparing department performance, or mapping metric evolution over time, this radial bar chart delivers a polished, professional aesthetic that elevates stakeholder alignment and supports data-driven decision making. With built-in legend placeholders and customizable iconography, teams across marketing, finance, or operations can tailor the slide to align with brand guidelines and narrative flow.
Who is it for
Product managers, marketing analysts, and data teams will find this radial bar chart invaluable for presenting performance metrics, product features, or key performance indicators in a clear, engaging format. Executives, consultants, and educators can use it to illustrate progress, compare departmental outcomes, or conduct strategic reviews. Its intuitive icon legend and radial layout simplify complex data communication for diverse audiences.
Other Uses
Beyond dashboards, repurpose this slide for product roadmaps, campaign performance reviews, and training modules. Use the radial segments to track sales targets, project milestones, market research findings, or team skill assessments. Adjust colors and icons to match brand identity or to highlight specific data narratives.
Login to download this file
Add to favorites
Add to collection

Item ID
SB00355