


Circular Business Strategy PowerPoint Template
Description
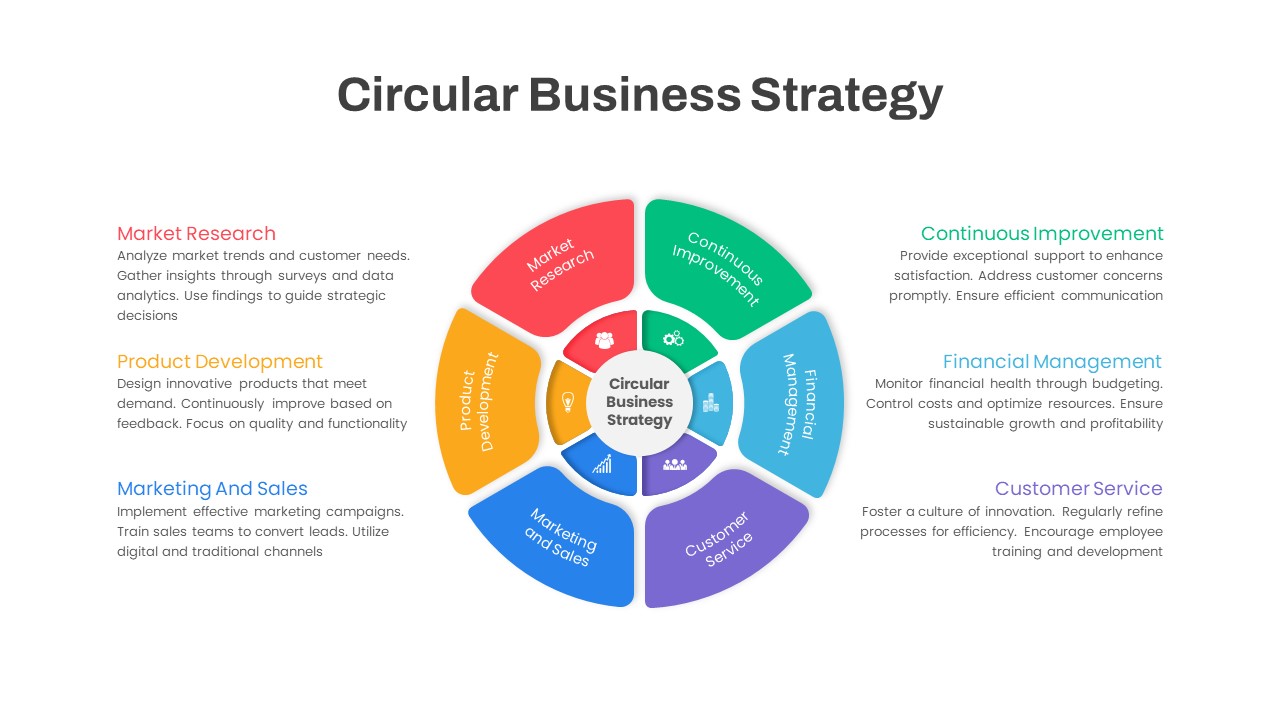
Transform complex strategic frameworks into a clear, circular infographic that highlights six essential business functions: Market Research, Product Development, Marketing & Sales, Customer Service, Financial Management, and Continuous Improvement. This fully editable slide features a central label surrounded by six color-coded segments and matching icons, with corresponding text callouts positioned on the left and right margins. Bold segment hues and subtle drop shadows maintain visual hierarchy, while abundant white space ensures readability and focus on key insights within PowerPoint and Google Slides environments.
Built on master slides, every element can be modified via drag-and-drop placeholders and global theme settings. Change segment colors, adjust angles, or swap icons and text with a few clicks, without disrupting layout integrity. The radial diagram preserves crisp vector shapes and legible typography across resolutions, while slide transitions and numbering remain uniform throughout your deck. Compatible with both PowerPoint and Google Slides, this template eliminates formatting headaches and streamlines collaboration for teams working across platforms.
The modular design also supports structural flexibility: duplicate segments to expand phases, realign callouts for alternate layouts, or layer your logo and background watermark behind the circle. Built-in alignment guides and gridlines guarantee pixel-perfect symmetry when resizing or repositioning elements. Whether you are illustrating a continuous improvement cycle, mapping a strategic roadmap, or showcasing departmental functions, this circular business strategy infographic slide conveys complex data with polished professionalism and intuitive visual appeal.
With color associations linking each segment to its explanatory text blocks, audiences instantly grasp functional relationships and process flow. Utilize this slide in executive briefings, project kick-offs, or analyst presentations where clarity and impact are paramount. Seamlessly integrate it into larger decks to maintain design consistency and reinforce your narrative.
Who is it for
Executives, marketing managers, strategy consultants, and project leads will use this infographic to present functional roadmaps and improvement initiatives. Business analysts, financial planners, and training facilitators can also adapt it to illustrate workflows, KPI frameworks, and cyclical review processes.
Other Uses
Beyond business strategy mapping, repurpose this circular diagram for product development lifecycles, risk management cycles, customer journey stages, or performance review metrics. Adapt segment labels to fit marketing funnels, compliance audits, or continuous learning frameworks across industries.
Login to download this file

Item ID
SB04368