


Key Drivers PowerPoint Presentation Slide Black
Description
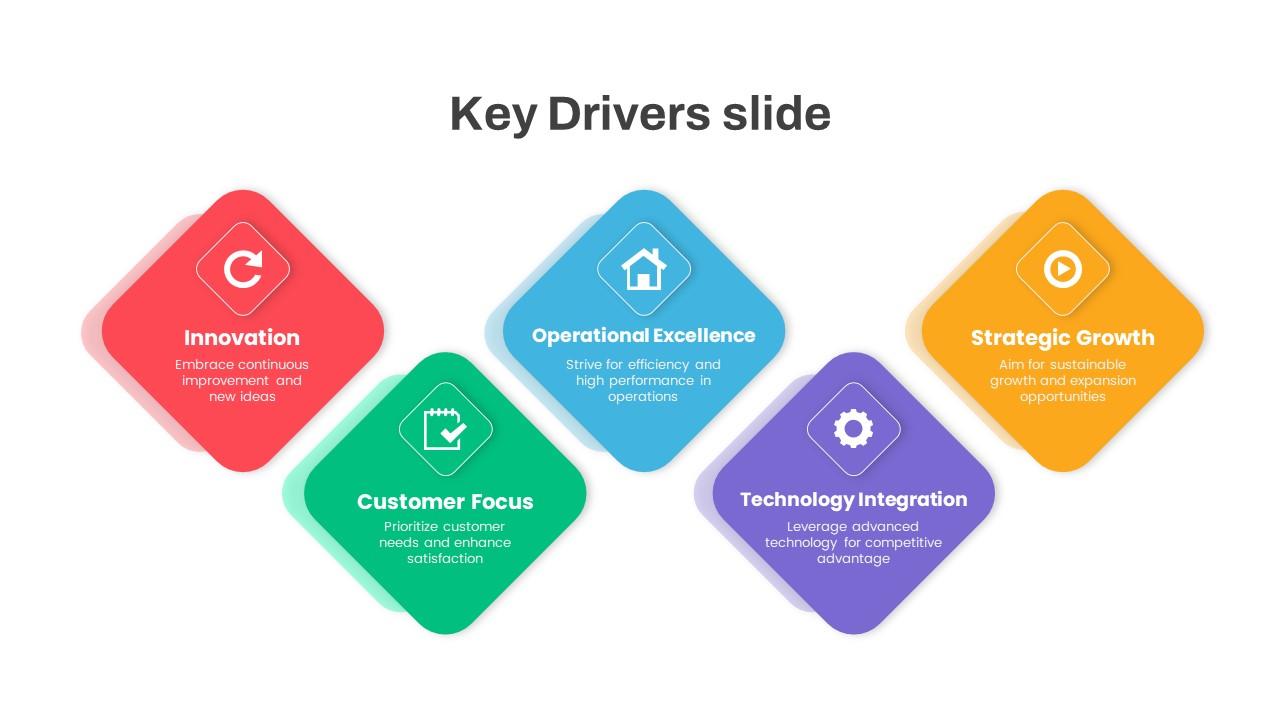
Use this versatile Key Drivers template to present the critical factors shaping your business strategy with clarity and visual appeal. It offers three distinct layout options: a diamond-shaped icon matrix supporting up to five drivers, a semicircular radial infographic for highlighting seven change drivers, and a three-column panel layout complete with an optional financial discipline bar. Each master slide features editable color-coded shapes, intuitive text placeholders, and a built-in library of business icons—letting you swap elements, adjust labels, and fine-tune color schemes in seconds. The modern flat design utilizes subtle drop shadows, rounded corners, and crisp typography to deliver a polished, professional aesthetic across devices.
Optimized for both PowerPoint and Google Slides, this template maintains full-resolution clarity and consistent formatting on any screen. Built-in master slides, customizable fonts, and intuitive placeholders streamline your workflow, reducing version-control headaches and enabling real-time collaboration. Tailor the palette to match your brand by editing the color themes or applying company-specific gradients. All placeholder objects are vector-based for infinite scalability without quality loss.
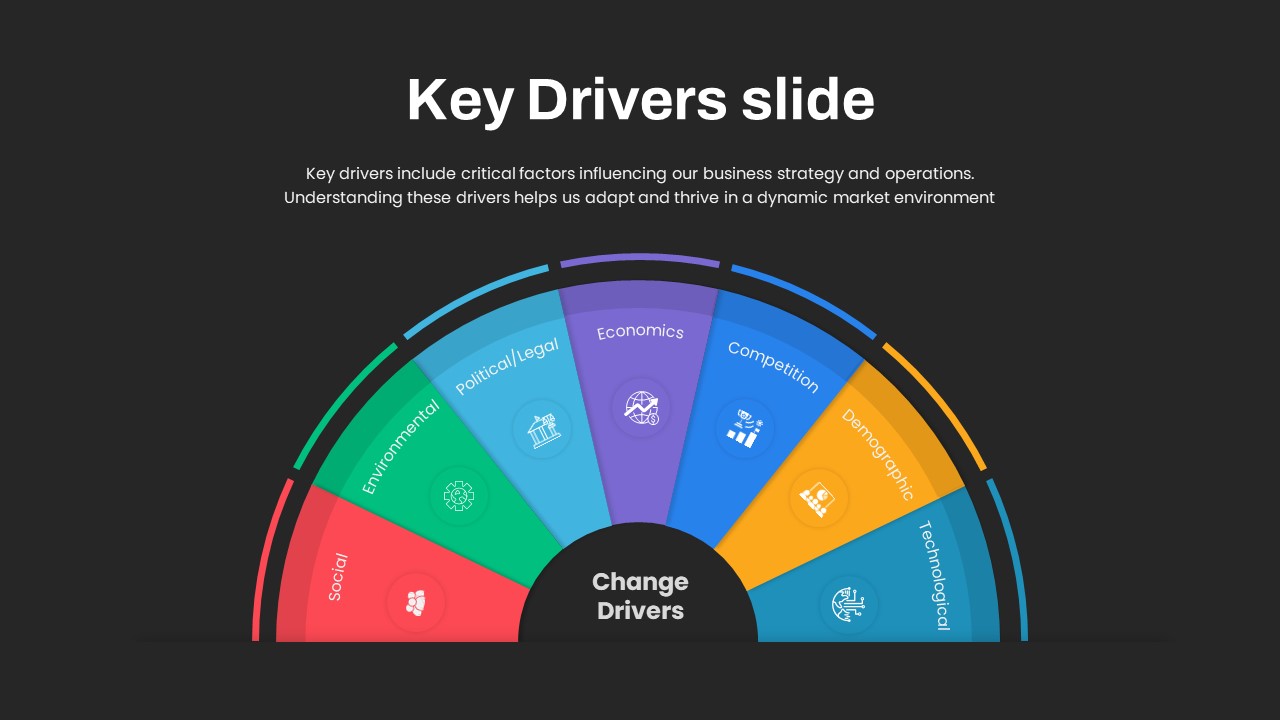
The radial infographic layout is preconfigured with PESTLE segments—including social, environmental, political/legal, economic, competition, demographic, and technological factors—making it ideal for context analyses and strategic change drivers. Whether you need to align stakeholders on innovation priorities, map execution roadmaps, or illustrate financial discipline, the structured layouts support data-driven discussions with minimal effort.
With clear, color-coded sections and concise iconography, this asset transforms complex information into digestible visual blocks. The flexible framework adapts to various content depths and slide counts, making it an indispensable tool for strategic workshops, executive briefings, or investor presentations.
Who is it for
Strategy consultants, business leaders, and product managers will benefit from this Key Drivers template when articulating core factors in boardroom meetings or stakeholder workshops. Marketing teams, project leads, and financial analysts can leverage the multiple layouts to simplify complex analyses and maintain alignment across departments.
Other Uses
Beyond listing strategic drivers, repurpose these layouts for PESTLE analyses, KPI dashboards, risk assessments, and roadmap visualizations. The diamond matrix can map customer priorities or vendor evaluations, the radial infographic suits market context studies, and the three-column panel supports financial reporting or departmental overviews.
Login to download this file
Add to favorites
Add to collection

Item ID
SB04345